
Size a diversifying sleeve to the correlation it shows when the book is under stress — not the average it posts across every environment.
7 min read | Sep 14, 2026
Most sizing decisions use one correlation number per sleeve. It's almost always the wrong one.
The figure that ends up in the risk model is a full-sample correlation: the sleeve's co-movement with the rest of the book, measured across its whole history. It's stable, easy to compute, and it blends two states that behave nothing alike: the long stretches when nothing is wrong, and the short windows when everything is. For a diversifier, only the second state earns its keep, and in that state the correlation is usually higher than the average implies. Often much higher.
Size to the average and you're sizing to a number measured mostly in the years you didn't need the diversification.
The example everyone already owns
Start with the sleeve every book holds: the bond leg.
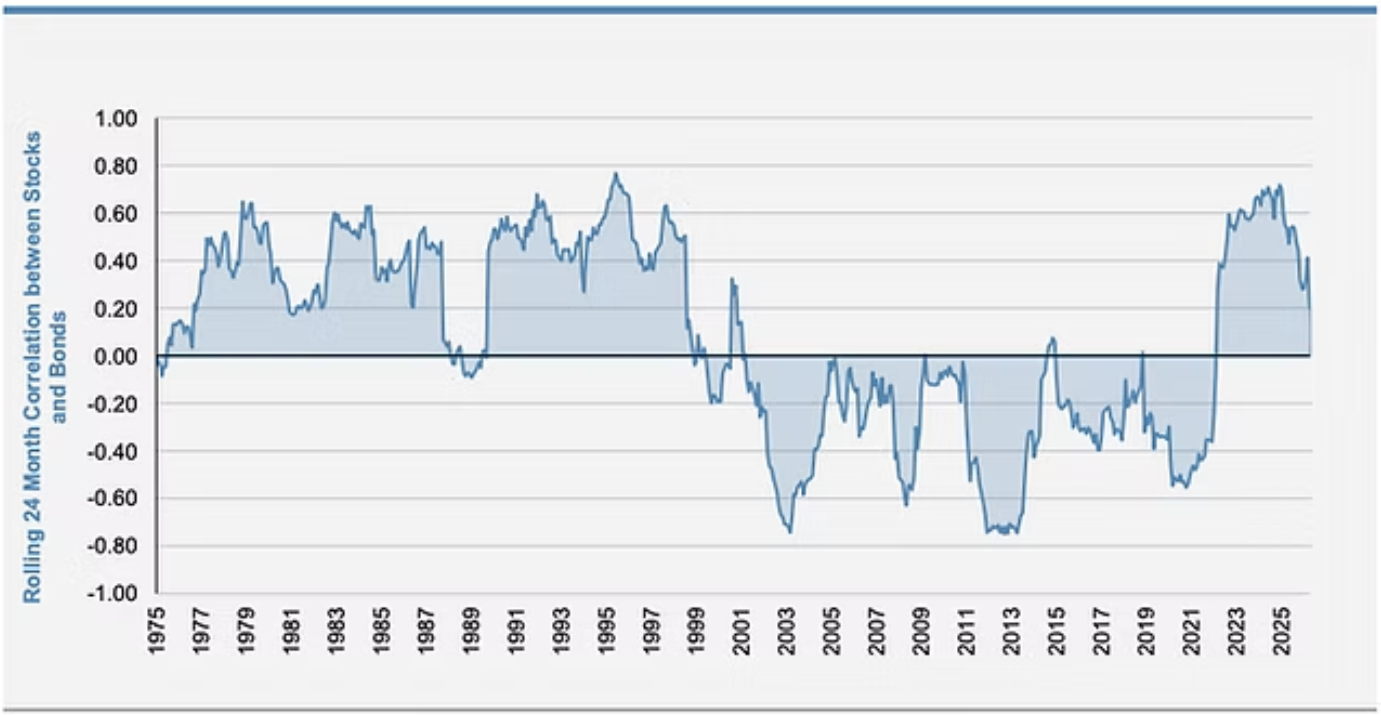
For roughly two decades, government bonds did the job a 60/40 asked of them. When equities fell, bonds rallied. The correlation sat comfortably negative, and the offset looked like a structural feature of the world. Then 2022 arrived and both legs fell together. The S&P 500 was down about 18% on a total-return basis, the Bloomberg US Aggregate down 13%, its worst year on record. And the correlation flipped positive, where it has stayed.
Rolling 24-month stock–bond correlation, 1975 → 2026
Source: S&P 500 Index & Bloomberg US Treasury Total Return Unhedged USD; Avail
Now look at what that single number hides once you split it by regime.
One Number, Two Regimes
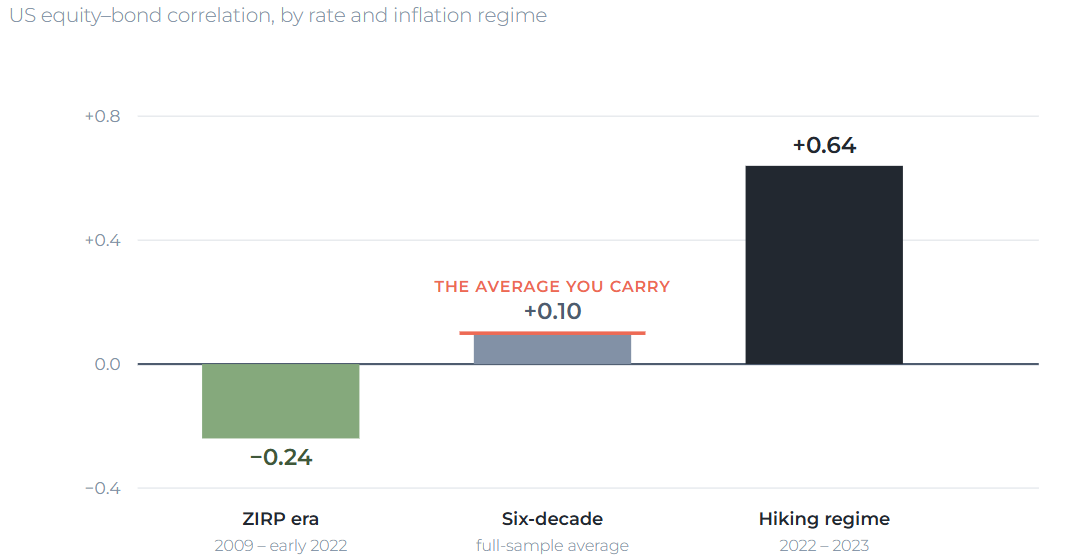
Source: Morningstar Direct (IA SBBI US IT Government vs. US Large Stock), rate-regime split; long-run coefficient over six decades. Figures rounded. The average is a blend of two regimes, and looks like neither. The full-sample correlation — roughly +0.1, the figure closest to what an unconditional model produces — sits near zero and looks harmless. It averages a regime in which bonds diversified strongly (≈ −0.24) with one in which they amplified the drawdown (≈ +0.64). You were never in the average; you were always in one regime or the other.
We made the wider version of this argument in Beyond the Mean. The point here is narrower and more practical. The correlation you feed the sizing model isn't one property of the sleeve. It's two, and the model only ever sees their blend.
Why the stress number is the worse number
The bond leg isn't a special case. It's the clearest instance of a general problem. For most diversifiers, the correlation you get in a crisis is worse than the one you get on average, and it's worse for a reason.
The full-sample figure is a weighted average, and the calm observations dominate it because there are so many more of them. So it sits closest to the calm-state correlation and furthest from the stressed one. The readings you have most of are the ones that matter least when you're actually losing money.
And the stressed correlation doesn't just drift higher by chance. Whatever hurts your core book in a drawdown, whether it's a liquidity event, a crowded-factor unwind or a rate shock, is often the same thing that drags the diversifier back toward it. A market-neutral sleeve looks uncorrelated until a deleveraging forces every crowded book to sell the same names at once, and its correlation to everything else then jumps at exactly the moment you were relying on it not to. We traced that mechanism in Crowding Isn't One Trade. The July 2026 equity unwind made the same point at the portfolio level: diversified multi-strategy books, built specifically to survive a single-factor hit, still lost around 2.2% on average as the correlations they'd been sized against shifted underneath them (Your Diversification Is Conditional).
This is what Position Sizing & Sell Discipline called diversification in name only: several sleeves that look independent on the fact sheet but lean on the same risk once it matters. The full-sample correlation is the statistic that lets it hide.
Sizing to the number that matters
None of this needs a regime-switching model. It needs a conditional input in place of an unconditional one. The habit matters more than the machinery.
Split the history with a crude stress rule. The worst decile of months for your dominant risk will do; so will a simple volatility or drawdown threshold. You are not forecasting the regime. Only separating the calm observations from the stressed ones.
Measure the sleeve inside the stressed subset. Its correlation or beta to your dominant risk in those windows is the number that describes what the sleeve does when you are actually leaning on it.
Feed that number into the process you already use. Put the stress-state figure, not the full-sample one, into whatever marginal-contribution-to-risk method sets your weights. The mechanics do not change. The input does, and the input was where the error was.
Cap shared exposure across sleeves. Three "different" strategies that all fail in a liquidity event are one bet, not three; size them as one.
The effect on the actual weight is not cosmetic.
The Weight Flips
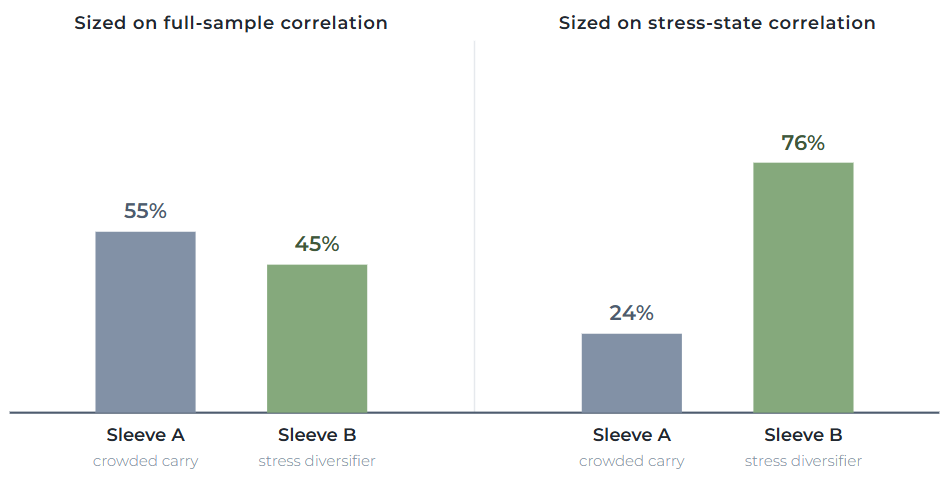
Source: Resonanz Capital. Illustrative — the mechanism, not point estimates. Two sleeves with the same standalone volatility and expected return. Sleeve A carries a low full-sample correlation to the book's dominant risk (0.15) but a high one in stress (0.70) — a carry or relative-value engine that crowds. Sleeve B is the reverse (0.30 average, 0.05 in stress): unremarkable on paper, genuinely diversifying when it counts. Weights shown are proportional to (1 − correlation), normalised — a transparent heuristic, not the optimiser. Sized on the average, A wins the larger weight and looks like the better diversifier; sized on the stress-state figure, the ranking inverts. Same portfolio, same method, same two sleeves.
Read the chart as a ranking tool, not a calculator. The stressed subset is small and noisy, and it won't give you a weight to two decimal places. Chasing one is how you overfit to a handful of bad months. Use it to order sleeves by the diversification they deliver under pressure, and set weights on the conservative side of that ordering. Then pair the number with the question that actually protects you: why would this sleeve correlate up in a crisis? If you can name the mechanism, the stress figure is telling you something. If you can't, treat a comforting one with suspicion.
A weight is not a constant
Sizing on a conditional input has a consequence: the output is conditional too.
A weight derived from stress-state behaviour is only right while that behaviour holds. When realised co-movement drifts past a sensible band, say the sleeve starts trending with the rest of the book or stops offsetting it, the weight you set is stale. That's a trigger to re-size, not a note to revisit at the next scheduled meeting. Treating sleeve weights as live resources rather than standing commitments is the discipline we set out in Sleeve Management, and conditional sizing is what makes it operational .
It also sits downstream of a prior decision. Before you size a sleeve, you should know what job it's there to do, which is the argument in Decide the Role Before You Read the Track Record. Role first, then size to the role's behaviour in the state where the role matters. A sleeve hired for crisis protection is sized on its crisis correlation, whatever its brochure Sharpe ratio says.
The number that pays
This is why an open-architecture multi-strategy book has to be built around conditional behaviour rather than headline statistics: each return engine weighted for what it contributes when the portfolio is under pressure, and that weight revisited as the regimes move. It's how Resonanz Jazz is run. Multiple return engines, each sized for the diversification it delivers in stress, not the diversification it advertises in calm.
The correlation on the fact sheet was measured, mostly, in the years you didn't need it. Size for the years you will.
Resonanz insights in your inbox...
Get the research behind strategies most professional allocators trust, but almost no-one explains.