
Your risk model's correlation is a calm-market average. Why it climbs in a selloff, what that does to a portfolio, and how to size for the real number.
5 min read | Aug 17, 2026
In July, an equity unwind ran through crowded technology and AI positions. The funds built to withstand exactly that kind of single-factor hit — diversified multi-strategy books — still lost about 2.2% on average. Asia-Pacific equity long-short managers lost roughly 9.4%. Return streams that had looked independent for years moved together the moment leverage came down.
That is the recurring problem with how books are diversified. The correlation you write into a risk model is an average across calm and stressed periods, and the calm periods dominate the record. It flatters the book. The correlation that actually governs the portfolio in a drawdown is higher, sometimes far higher, than the one in the model.
The number you measured is the number you had in calm markets
Take the relationship most portfolios are built on. Through the low-rate years from 2009 to early 2022, US stocks and bonds ran at about −0.24. Bonds rose when equities fell, and the 60/40 earned its reputation on that. Through the 2022–23 inflation shock the correlation went to +0.64. On a three-year basis it peaked at 0.66 at the end of 2024. The hedge a generation of portfolios leaned on stopped hedging, and stayed that way for years.
The one correlation everyone relied on flipped sign
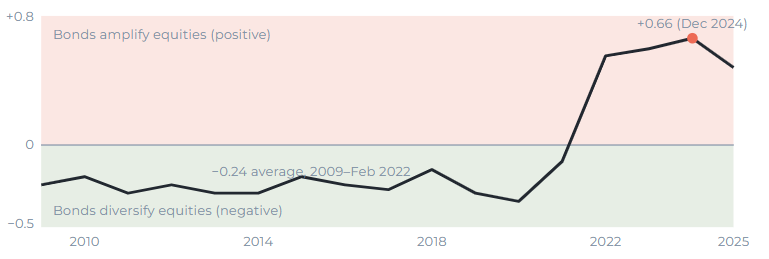 Source: Resonanz Capital. Anchor values: Morningstar (−0.24 in 2009–Feb 2022 vs +0.64 in 2022–23) and State Street Global Advisors (36-month reading peaking at 0.66 in Dec 2024, easing to 0.48 by Sep 2025). Path between anchor points is indicative.
2022 showed the bill. The 60/40 fell 17.5%, its worst year since 1937. Both legs lost at once: the S&P 500 was down about 18% on a total-return basis and the Bloomberg US Aggregate about 13%, the worst year in that index’s history, over the same twelve months. The ballast did nothing.
That was a slow move. The correlation drifted positive over months as inflation took over as the driver. A selloff does the same thing in days, and for different reasons.
Why correlations rise in a selloff
In a sharp drawdown, three things happen at once, and each pushes correlations up.
- Funding. A margin or liquidity shock hits every leveraged position together. What gets sold is not what has deteriorated on fundamentals; it is whatever can be sold to raise cash. Positions move together because they share a seller, not because they share a thesis.
- Forced deleveraging. Volatility targets, VaR limits and margin desks all give the same instruction on the same day: cut risk. When the same books are cut at the same time, the selling itself creates the correlation.
- The hidden factor. Positions that look varied by label often carry the same underlying exposure — duration, liquidity, the AI-capex cycle. In calm markets that factor sits quiet and the book looks diversified. In a stress it drives everything at once, and the diversification was never really there. We made this risk-factor argument at more length last year.
The common point: diversification needs your positions to be reacting to different things. A large enough shock is the same thing happening to all of them.
Expected equity correlation: what calm markets price vs what a crash prices
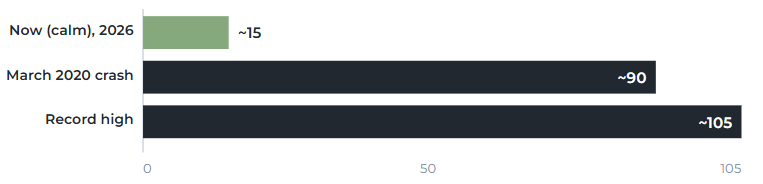 Source: Resonanz Capital. Data: Cboe S&P 500 Implied Correlation Index (expected average correlation across index constituents); current level and historical spikes as reported by Cboe. Indicative levels. cboe.com
Equity investors can watch this directly. The Cboe Implied Correlation Index — the market’s estimate of how tightly S&P 500 names will move together — sits near 15 when conditions are calm. In the March 2020 crash it jumped to around 90. Its record is about 105. Your model assumes something like 15; the event you are protecting against runs at 90 or more.
What that does to a book
Hold more than a handful of positions and the book’s volatility is driven mostly by the average correlation between them, not by any single position’s risk. Here is what that looks like for ten equally sized positions, each with 15% volatility, as the average correlation between them rises.
What rising correlation does to a diversified book
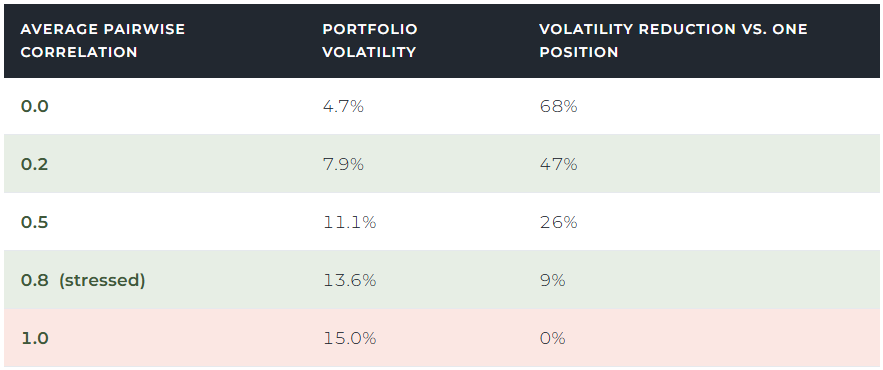
Source: Resonanz Capital. Illustrative: ten equally-weighted positions, each at 15% annualised volatility. Portfolio volatility = σ√(1/N + (1−1/N)ρ); the final column is the reduction versus holding a single position.
At zero correlation, ten positions cut volatility by roughly two-thirds. At 0.8, a normal reading in a stressed market, the reduction is under 10%. Most of the diversification you were relying on is gone in the one environment you were relying on it for.
Size it that way
None of this means diversification doesn’t work. It means the number you feed it is wrong. A book sized on calm-market correlation is sized for a market it will not have to survive in. Three things follow from that.
- Size on the stressed correlation, not the average. Look at what a pair does in the worst tenth of outcomes and size as if that is the normal relationship. The record says the tail number is closer to what you will actually live through than the full-sample figure.
- Treat the correlation matrix as an assumption and stress it. It is an input you chose, not a fact you measured. Push it to a crisis regime and re-read the book’s volatility and drawdown. If it only holds together at calm-market correlations, it does not hold together.
- Tell structural diversification apart from statistical diversification. Two strategies are genuinely diversified when they make money from different, unrelated things, not when their past returns happened not to line up. The second kind breaks under a common shock. The first is harder to break. Know which one you are paying for.
The correlation in your risk model is a calm-market number. Build the book for the one you will get when it matters, not the one you measured when it didn’t.
Resonanz insights in your inbox...
Get the research behind strategies most professional allocators trust, but almost no-one explains.