
Why systematic implementation, not the signal, has changed the crash.
6 min read | May 19, 2026
Momentum has not stopped working. What has changed is what happens when it starts to unwind. The strategy’s tail risk is now endogenous to the size of the systematic complex that runs it — and most portfolios are still priced on a distribution that no longer describes the world.
Momentum was never risk free
The cross-sectional momentum signal travels across equity markets and asset classes alike. It earned a permanent institutional seat because the empirical record was hard to argue with.
The same literature flagged the principal weakness early. Momentum portfolios suffer episodic, violent reversals — typically when prior losers rally hard after stress periods. March 2009 is the canonical example. The crash is not a slow bleed; it is a regime shift in the short-term cross-section that punishes the short book in a matter of weeks.

Daniel & Moskowitz (2016) — cumulative returns of winners and losers through the March 2009 and 1930s reversal episodes — In both crashes, the short book does the damage.
For two decades, the profession treated these episodes as exogenous tail events. Rare, sharp, explainable after the fact. A property of the world, not a property of the strategy. That framing has aged poorly.
Momentum became infrastructure
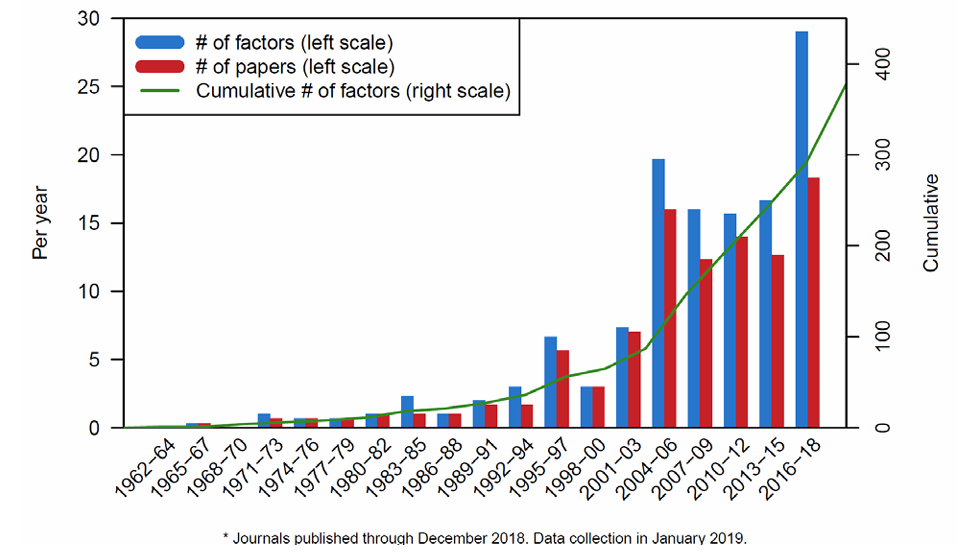
Harvey, Liu & Zhu (2019) — cumulative count of factors published in peer-reviewed finance journals, 1980–2012 — The factor universe roughly doubled in the last decade of the sample.
The structural change since roughly 2015 is not in the signal. It is in the implementation footprint.
A decade ago, systematic momentum sat inside a handful of CTAs, a few quant equity books, and academic replications. Today it is everywhere. QIS indices have packaged it into bank-balance-sheet-friendly products distributed at scale. Factor ETFs have made it widely available. CTAs have grown. Risk-parity sleeves embed trend-following at the macro level. Volatility-targeting overlays — now standard in multi-asset construction — behave like momentum in stressed regimes, because rising volatility forces selling of whatever has just moved.
Machine-driven portfolio systems do not need to know they are running momentum. Many of their objective functions point in the same direction regardless.
Once a factor moves from academic discovery into mass implementation, the strategy stops being “long winners, short losers” — it becomes long whatever the entire systematic complex is long. The signal gets commoditised. The positioning does not.
The reflexive crash mechanism
What this changes is the transmission mechanism of a drawdown.
The classical crash is essentially a story about the cross-section of stocks: violent losers rebound, the short book hurts, the long book underperforms, and the strategy bleeds for a quarter. The shock is real but contained.
The industrial-scale version is different. Six things tend to happen in sequence:
-
A large fraction of the systematic universe owns the same names, in the same direction, sized off the same signal lookbacks.
-
When the tape turns, trend models — built off broadly similar mathematics — start cutting at the same time.
-
Position sizes have scaled faster than the marginal liquidity available to exit them.
-
The reversal raises realised volatility, which mechanically triggers deleveraging in every volatility-targeted book simultaneously.
-
That deleveraging is non-discretionary — it does not care about valuations.
-
And books that looked diversified in calm regimes suddenly behave like one trade, because they are all unwinding the same underlying exposure.
The loop is reflexive: rising volatility forces deleveraging, deleveraging forces selling, selling raises volatility. The mechanism is endogenous to the size of the systematic complex. It did not exist at this scale fifteen years ago.
The post-2015 fingerprint
The post-2015 sample is short, and any single episode can be explained away. The pattern is hard to ignore.
February 2018 was a vol-targeting feedback loop that punished short-vol and momentum-adjacent positioning together. March 2020 produced one of the sharpest factor reversals on record, with COVID-rebound losers ripping into long books inside two weeks. The 2022 rates-driven unwind of long-duration and tech-quality factors carried the same crowding signature, only slower.
A careful reader will note that COVID and the 2022 rates repricing were extraordinary macro events in their own right — but the endogenous mechanism is still the better explanation: the speed and synchronicity of both unwinds were disproportionate to their macro drivers, consistent with a system that had pre-positioned in the same direction and was forced to exit simultaneously rather than simply repricing fundamentals.
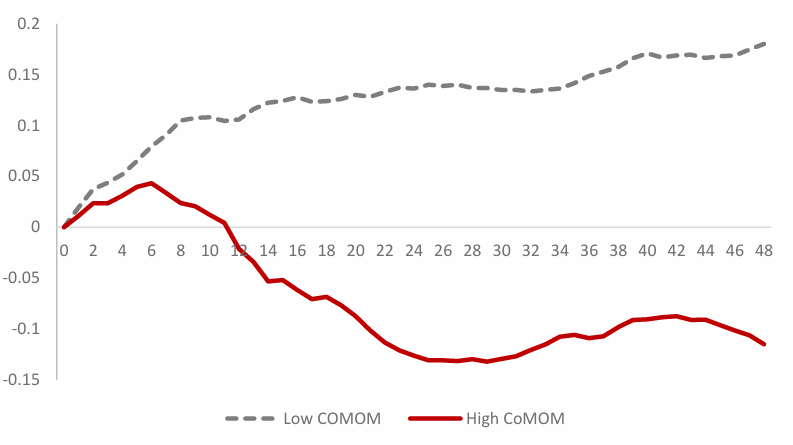
Lou & Polk (2022) — forward momentum returns sorted by comomentum at formation. The chart shows the compounded returns to a value-weight momentum strategy (i.e., winner minus loser deciles) in the four years after formation, following low and high comomentum. When the trade is crowded at formation, the subsequent path is materially worse.
Lou and Polk's work on comomentum makes this operational. Pairwise abnormal return correlation inside the momentum portfolio is a measurable, real-time crowding proxy — and it predicts subsequent crash severity. Crowding is not a vague concept. It is observable, and it cycles.
What this means for the portfolio
The wrong conclusion is “momentum is broken.” The behavioural reasons for momentum to persist — under-reaction, slow information diffusion, anchoring — have not gone away.
The right conclusion is more uncomfortable. The signal is fine. The implementation profile has changed. Two investors running notionally similar momentum exposure can now sit in radically different left-tail regimes depending on the leverage, vol-targeting, and liquidity assumptions inside their book.
The unconditional Sharpe of a momentum sleeve is the wrong anchor if the conditional left tail has fattened. So is the historical drawdown depth, if the recovery path is structurally faster and sharper than the data window suggests. What needs to be priced is the convexity: investors carrying industrial-scale, vol-targeted, factor-overlap-heavy momentum exposure are short an option whose underlying has scaled with the industry.
Momentum as a behavioural signal is one thing. Momentum as a crowded liquidity trade with synchronised exits is another. The two now share a name. They do not share a risk profile.
The most actionable implication follows directly from the comomentum evidence. If crowding is observable at formation — measurable through pairwise abnormal return correlation inside the winner and loser legs — then it can be used as a sizing discipline rather than an afterthought. When comomentum is elevated, scale down: the left tail has thickened and the exit queue is already forming. When it is low, the signal is running in lighter traffic and the empirical distribution is closer to what the older literature described. This is not a hedge. It does not require exotic instruments. It requires reading the crowding signal before committing to the trade, and sizing accordingly.
Closing
The next chapter of momentum investing will be defined less by signal discovery and more by managing the reflexive risks that scale has created. The strategies that absorb the next industrial-scale reversal well will not be the ones with the cleverest signal. They will be the ones whose implementation was built on the assumption that the tail is a function of the crowd — not a property of the world.
Resonanz insights in your inbox...
Get the research behind strategies most professional allocators trust, but almost no-one explains.