
Multi-PM hedge funds excel in performance and asset growth, but struggle with high costs and talent retention due to their headcount-intensive model.
7 min read | Dec 27, 2022
In February of this year, we highlighted a trend amongst hedge funds of locking up investors capital for longer time periods, but we noticed that this trends applied to a small number of successful managers, both in terms of recent performance as well as asset raising. This small group was by far dominated by multi-PM hedge fund platforms (or “MMPs”: e.g. Millennium, Citadel, D.E. Shaw), which secured pretty much all of the new money in the hedge fund industry in 2021, confirming a shift that occurred since the start of the Covid pandemic. This year, 2022, has seen a continued outperformance of these managers as group (next to global macro), further cementing the dominance of the multi-PM model in terms of attracting investors’ capital as well as hedge fund talent. Later in the year, in September, we analyzed the MMPs universe in more detail by focusing on some of the headcount dynamics that characterize this space.
A recent paper by Goldman Sachs titled “The Multiplier Effect: The landscape and evolution of the multi-manager hedge fund model” has confirmed some of our observations and provided additional insights, the more important of which are summarized below.
A Rising Tide In Asset Growth For MMPs Also Benefits Smaller Players
The rise to prominence of the MMPs is a relatively new phenomenon, which only took place over the last 5 years. In fact, while this group’s AuM grew at a slower pace than the rest of the industry between 2010-17, they have seen a meteoric rise of their assets from 2018 onwards, at a CAGR that is almost 6x that of the remainder of the hedge fund industry.
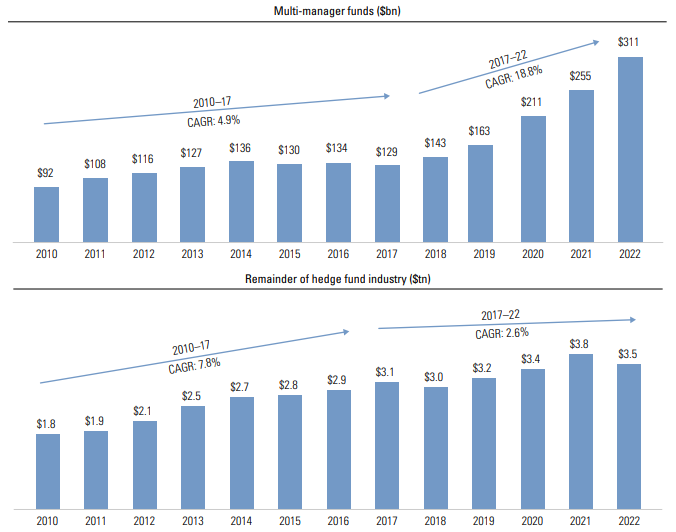
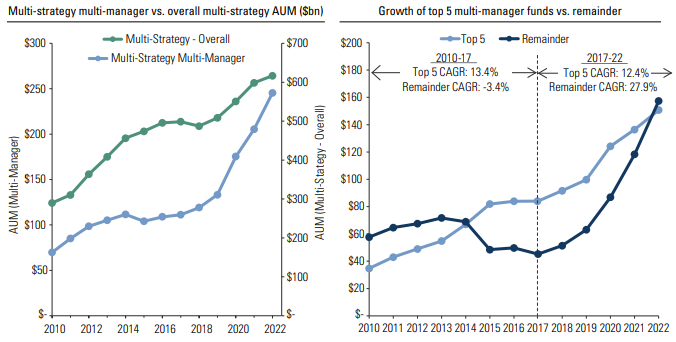
In addition, while the category of MMPs tends to be dominated by a small group of very large managers (5 to 10), many of these have either been reaching closer to their capacity, redistributing capital back to investors, and/or even locking up investors for longer time periods. This trend seems to have benefited smaller competitor firms which have been able to capture some of that excess demand and thus have seen their collective AuM grow as a result.
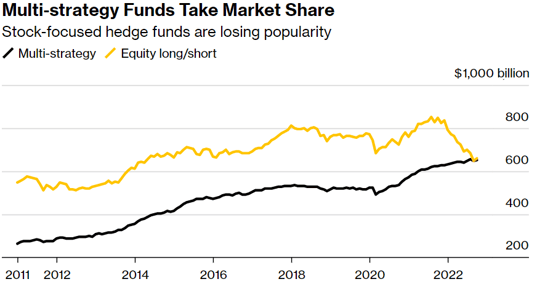
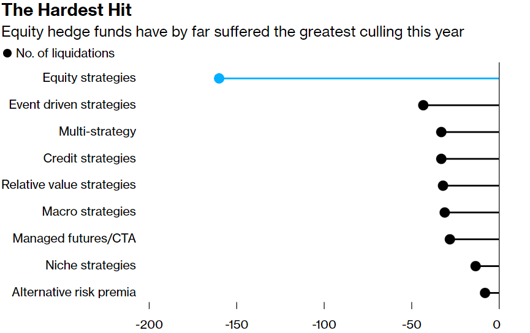
However, this marks a stark contrast in asset flow dynamics with the rest of the hedge fund industry, where the asset raising environment in 2022 has been particularly challenging, especially within the equity long-short community.
A Small Group Packing A Big Punch
Resonanz Capital estimates that the top 35 MMPs globally total around $330bn of AuM, which represents around 8-9% of total hedge fund assets globally. In fact, this group also often exhibits relatively homogeneous characteristics such as high gross and low net exposure, with tight risk management controls. As a result of their collective high gross exposure (5 to 10x), MMPs have a much larger equity market footprint than their aggregate AuM suggests, which is estimated by Goldman Sachs at 27% of the gross market value held by hedge funds in US equities, up from 14% in 2014. This means that due to their tight risk management controls (tight stop-losses) combined with their high gross exposures, MMPs may have a real market impact on market structure during “de-grossing” episodes such as in Q1 2020 or January 2021, with a potential of further exacerbating price dislocations across a large number of equity securities, especially when considering leverage levels and/or crowding risks that MMPs present.

The Performance To Back It Up
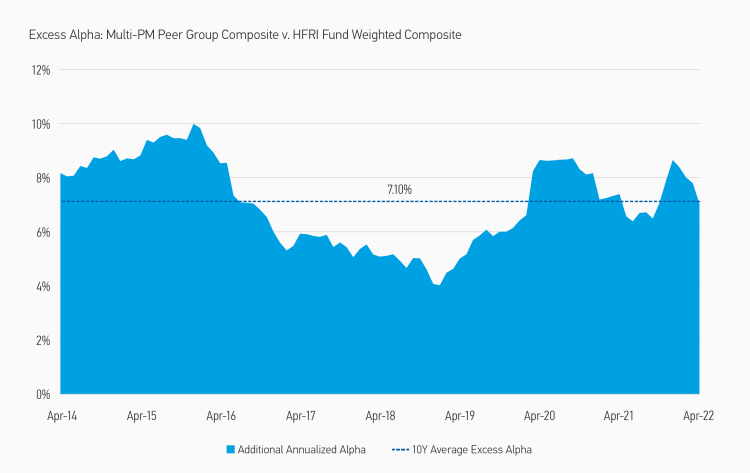
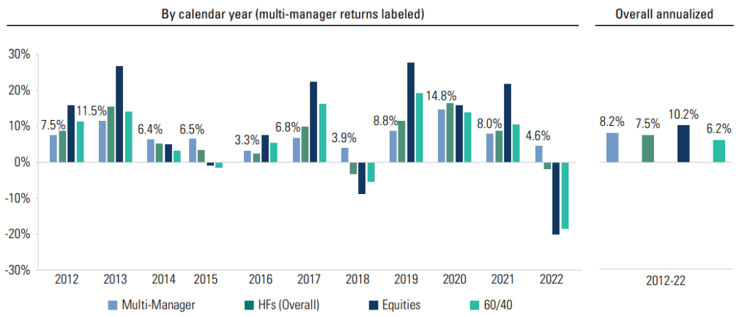
Perhaps the increased investors interest in this corner of the hedge fund world is best justified by the recent outperformance that the MMPs community has had over the broader multi-strategy community, as well as over the rest of the hedge fund world. In fact, while the absolute return of MMPs as a group has been largely unremarkable over the last decade (with an excess return +0.7% p.a. vs HFs; +1.5% p.a. vs 60/40 portfolio; -2% p.a. vs global equities), they have however shined much brighter in the last 5 years by delivering a higher quality in terms of risk-adjusted returns and alpha, be it against equities or the rest of the hedge fund inverse.
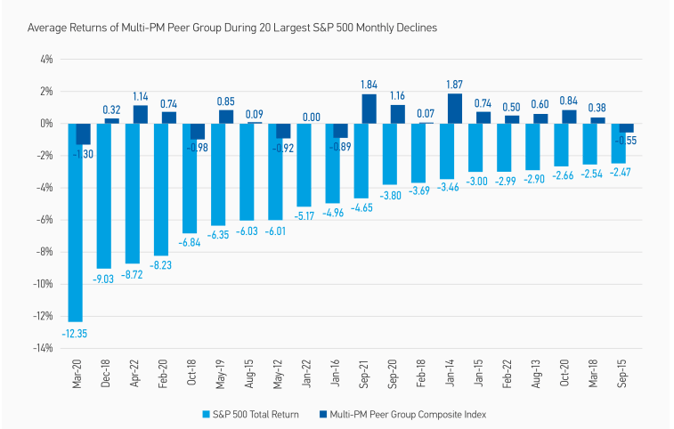
Another compelling feature that speaks in favor the MMPs’ market neutrality is their performance during some of the worst down-market periods. Morgan Stanley’s shows that their equal weighted multi-PM composite (32 members) has largely been successful in protecting capital during periods of market downturn.
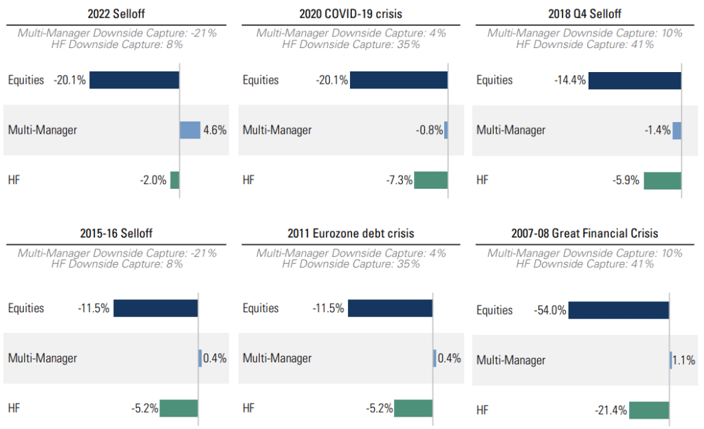
Similar conclusions can be drawn from looking at the data compiled by Goldman Sachs, which emphasizes superior capital preservation capabilities of MMPs vs. other multi-strategy funds and vs. the broader hedge fund industry. This further showcases the value added by the multi-PM platform’s focus on market neutrality and tight risk management in terms of capital preservation.
Bigger Is Better
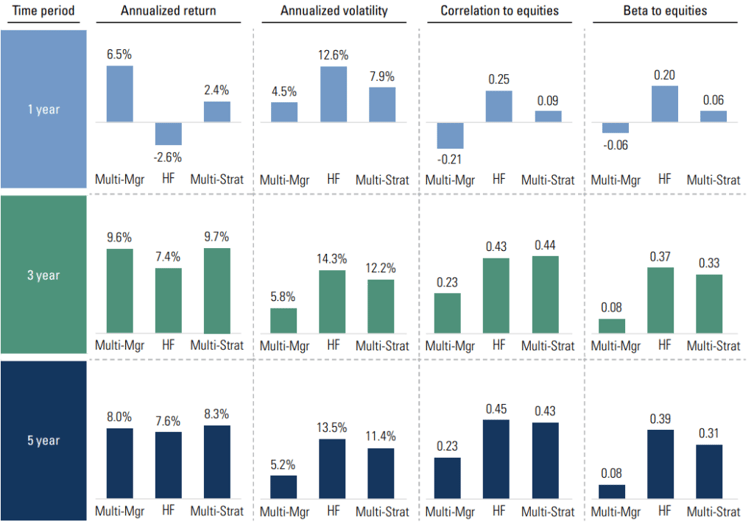
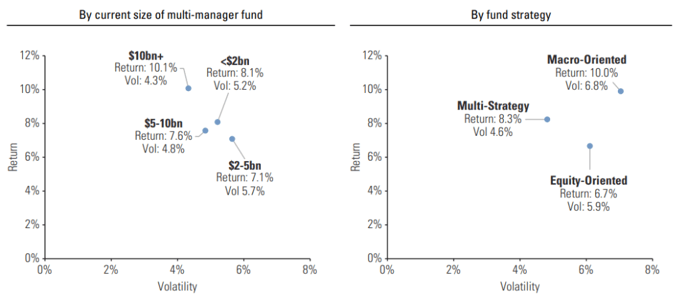
While the MMPs have delivered strong risk-adjusted returns together with downside protection over the last 5 years on aggregate, there is still some dispersion within this group. This dispersion can be attributed to different factors, especially the fund size as well as the strategy tilt. In fact, according to the data compiled by Goldman Sachs, one can see that larger funds have outperformed on a risk-adjusted basis (e.g. better Sharpe ratio) than smaller funds, while multi-strategy focused funds have slightly outperformed relative to macro-oriented (highest absolute return), whereas equity-oriented strategies lag significantly.
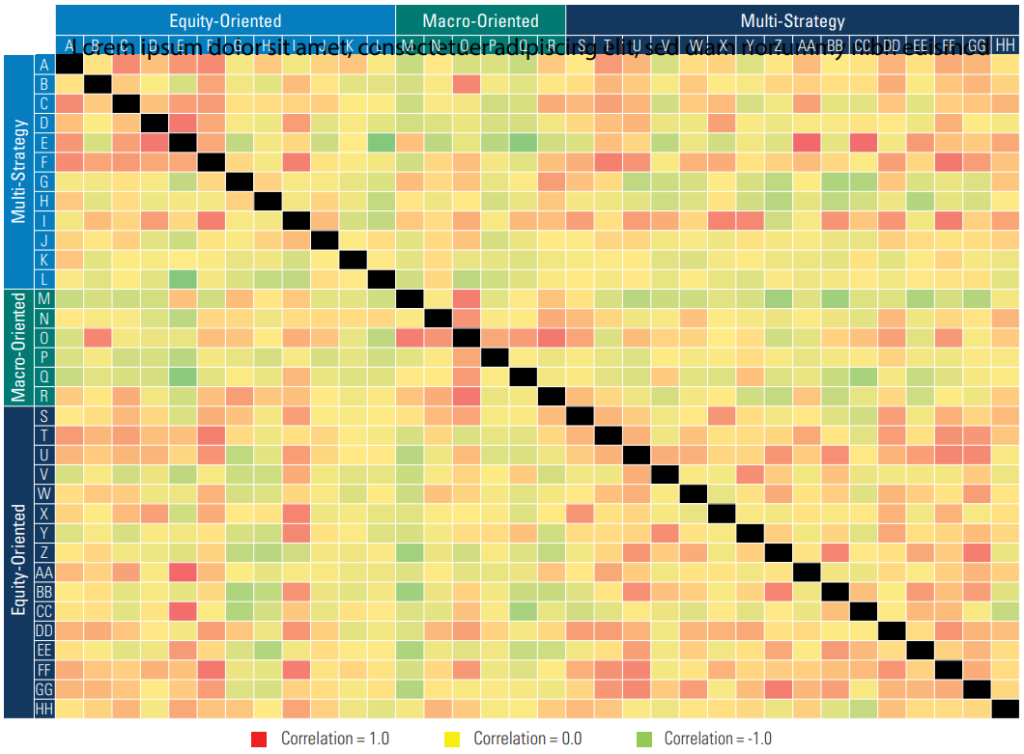
Looking at correlations between the various MMP groups, namely equity-oriented, macro-oriented and multi-strategy, correlation statistics suggest potential diversification benefits in holding multiple MMPs in a portfolio.
- The average correlation between any two funds, regardless of their group classification, appears relatively low (ca. 0.23)
- The average correlation within each group is highest for equity-oriented strategies (ca. 0.5) and lowest within multi-strategy (ca. 0.3)
- The average correlation between groups appears low
Some Challenges To Assess When Considering A MMP Allocation
Given investors’ unprecedented high demand for multi-PM products, finding the right talent to manage capital is arguably the number challenge facing these MMPs. In fact, the very nature of the multi-manager business model dictates a lack of operating leverage from a headcount perspective. This leads to two main issues downstream:
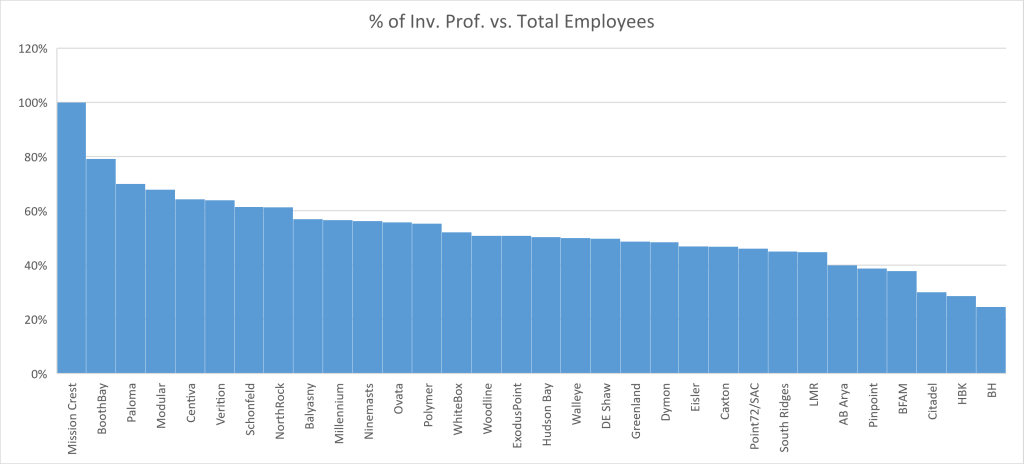
- MMPs are significantly more headcount-intensive compared to single-manager hedge fund model, as judged by the both ratios AuM-to-investment professionals or AuM-to-total headcount, regardless of the size of the multi-manager platform. Note that half of the headcount is composed of investment professionals, on average
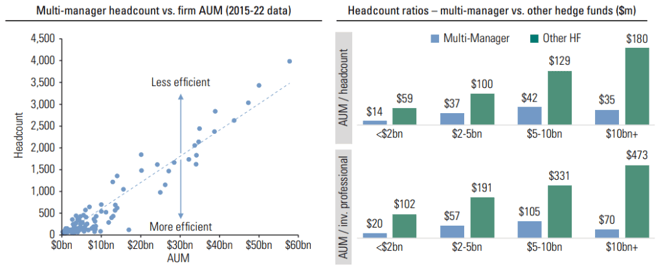
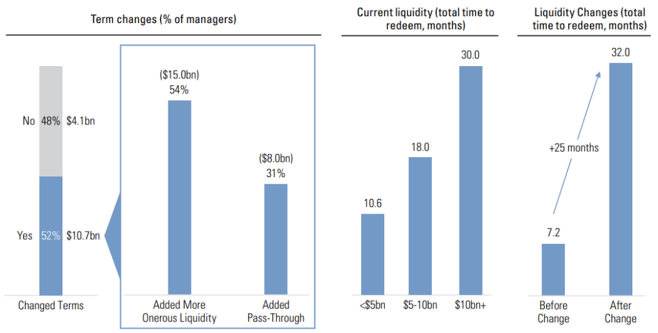
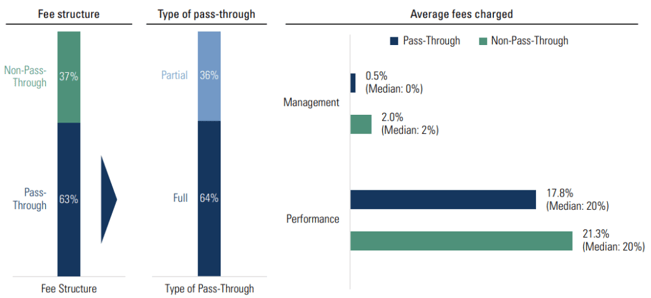
- This apparent lack of business model efficiency inevitably leads to high pass-through costs and less favorable liquidity terms in order to ensure sustainability, given the “war on talent” that leads to increasing levels of formulaic payouts for PMs. On the other hand, those MMPs in the minority not using pass-through tend to have a more expensive fee structure than the rest of the industry
Resonanz insights in your inbox...
Get the research behind strategies most professional allocators trust, but almost no-one explains.