
The term premium just turned positive for the first time in a decade. Here’s why that reprices risk parity, carry, and every levered bond trade.
10 min read | Oct 12, 2026
The ten-year Treasury touched about 5.3% at the end of September, its highest in nearly twenty years. The number worth your attention isn't the yield, though. It's what sits inside it.
Any long yield splits into two parts. There's the average short-term interest rate the market expects over the life of the bond, and there's a term premium, the extra compensation investors demand for locking money up and bearing the risk that rates move against them along the way. For most of the last decade that premium was close to zero, and often below it. Investors were taking on the risk of a long bond for almost no extra reward, and at times for less than nothing.
That has changed, and it's the part of the move that matters most for how you run a levered book.
What a term premium actually is
Since the rest of this piece leans on the term, it's worth being exact about it. When you buy a ten-year bond, you are really taking a view on the path of short-term interest rates. If rolling a series of short-term bills over ten years were expected to pay you the same as holding the ten-year outright, the long yield would simply equal the average short rate the market expects over that decade. It rarely does. Investors ask for a little extra to lock money up for ten years and to carry the risk that rates, inflation or bond supply surprise them along the way. That extra is the term premium.
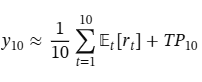
10-year yield ≈ average short rate expected over the next 10 years + term premium,
or more formally:
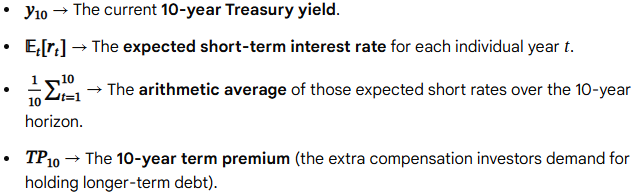
Strip the premium out and you are left with the textbook "expectations" view, where a long yield is nothing more than the average of expected short rates. The term premium is the gap between that clean theory and the messier real world. It is usually positive, because investors want paying to hold duration. It can also go negative, which is what happened for much of the last decade, when long bonds were prized enough as a safe-haven hedge that buyers accepted a yield below the expected path.
The New York Fed's model splits the yield into a rate forecast and a risk premium.
What's inside a 10-year yield
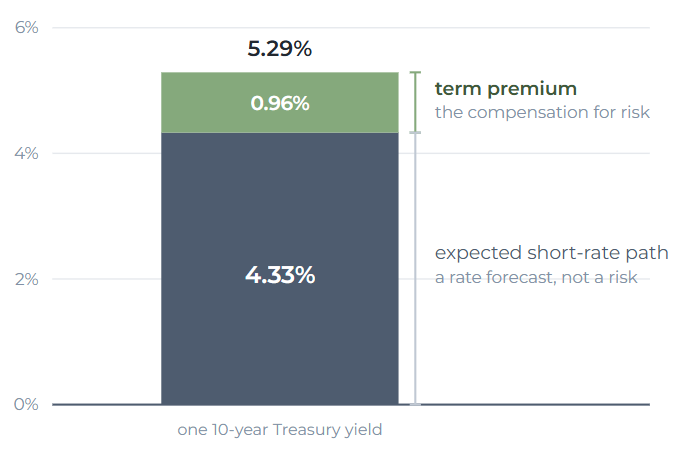 Source: Resonanz Capital
One clarification, because the two often get confused. The term premium is not the slope of the yield curve. The slope, the gap between the two-year and ten-year yields, is something you can read straight off a screen, and it blends expected rate changes together with term-premium differences across maturities. The term premium is maturity-specific compensation that has to be estimated, and you can run a positive term premium alongside a flat or even inverted curve.
Because it is the one part of the yield you cannot observe directly, the term premium has to be modelled. Two broad schools do the job.
Two ways to measure it
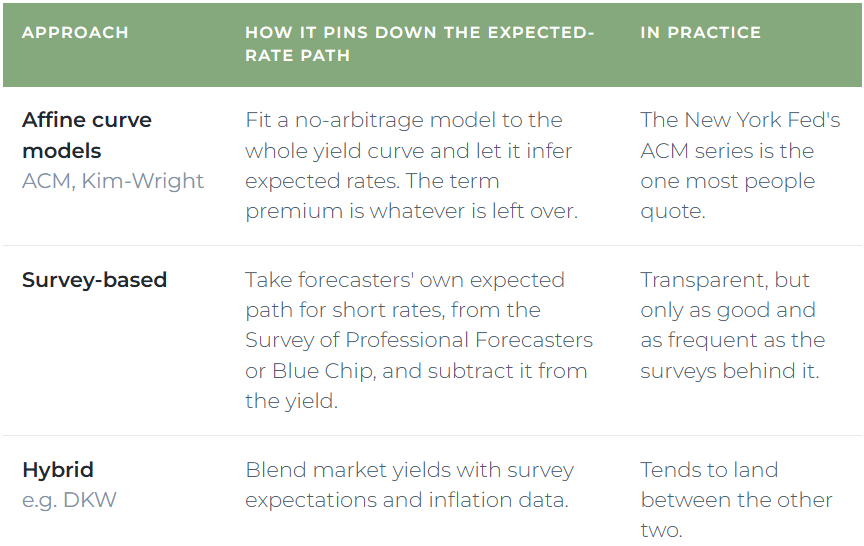 Source: Resonanz Capital. All three decompose the same yield. They differ only in how they fix the expected-rate path, and because that path is itself an estimate, the term premium that falls out is an estimate too.
None of these is the single correct answer. The term premium is a residual, the piece left once you subtract an estimate of expected rates, so the main models can disagree by half a point to a full point on the same day. Treat the level as directional, not exact. They do agree on the direction, though, and the direction is what the rest of this piece turns on.
What's inside the yield
On the New York Fed's widely used model, the ten-year term premium sat below zero in 89 of the 99 months from 2016 to 2024. It crossed back above zero in October 2024 and has climbed since, reaching about +0.9% in September 2026, the highest reading since 2014. After a decade of charging almost nothing to hold long bonds, the market is charging again.
A decade of charging nothing, then a turn
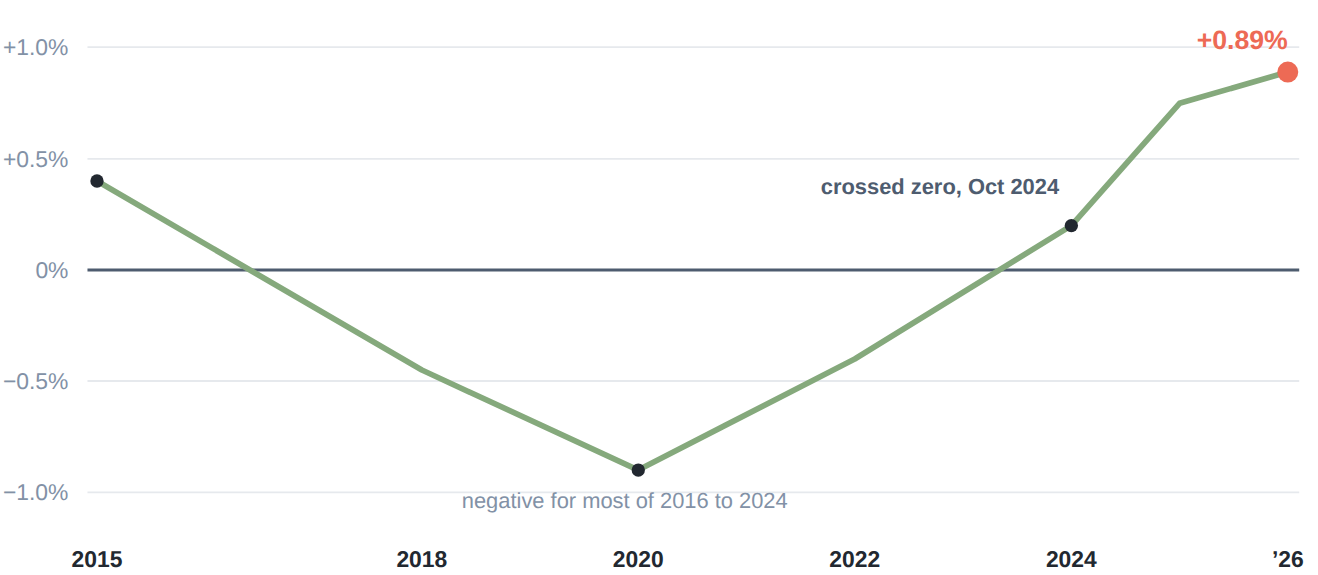
Source: Federal Reserve Bank of New York, Adrian-Crump-Moench model (series ACMTP10), monthly through September 2026. Readings before 2025 are approximate. The term premium is not observed directly. It is a model estimate, and different models can disagree by half a point or more, so treat the level as directional rather than precise. Every serious estimate, though, tells the same story.
A caveat before going further, because it's easy to overstate this. The term premium can't be measured directly. It's whatever is left in the yield after you strip out expected short rates, so every number is a model's best guess, and the main models disagree by as much as half a point to a full point on the same day. Don't manage to a single decimal. But the direction is not in dispute.
The reasons it turned have been building for a while. Quantitative tightening handed a large amount of duration back to private buyers. Persistent deficits mean heavy issuance for those buyers to keep absorbing. And an inflation shock taught the market that long bonds are no longer a one-way bet. You don't need to forecast where the premium goes next to deal with the fact that it's here.
Ten-Year Treasury Premium and Yield Fit
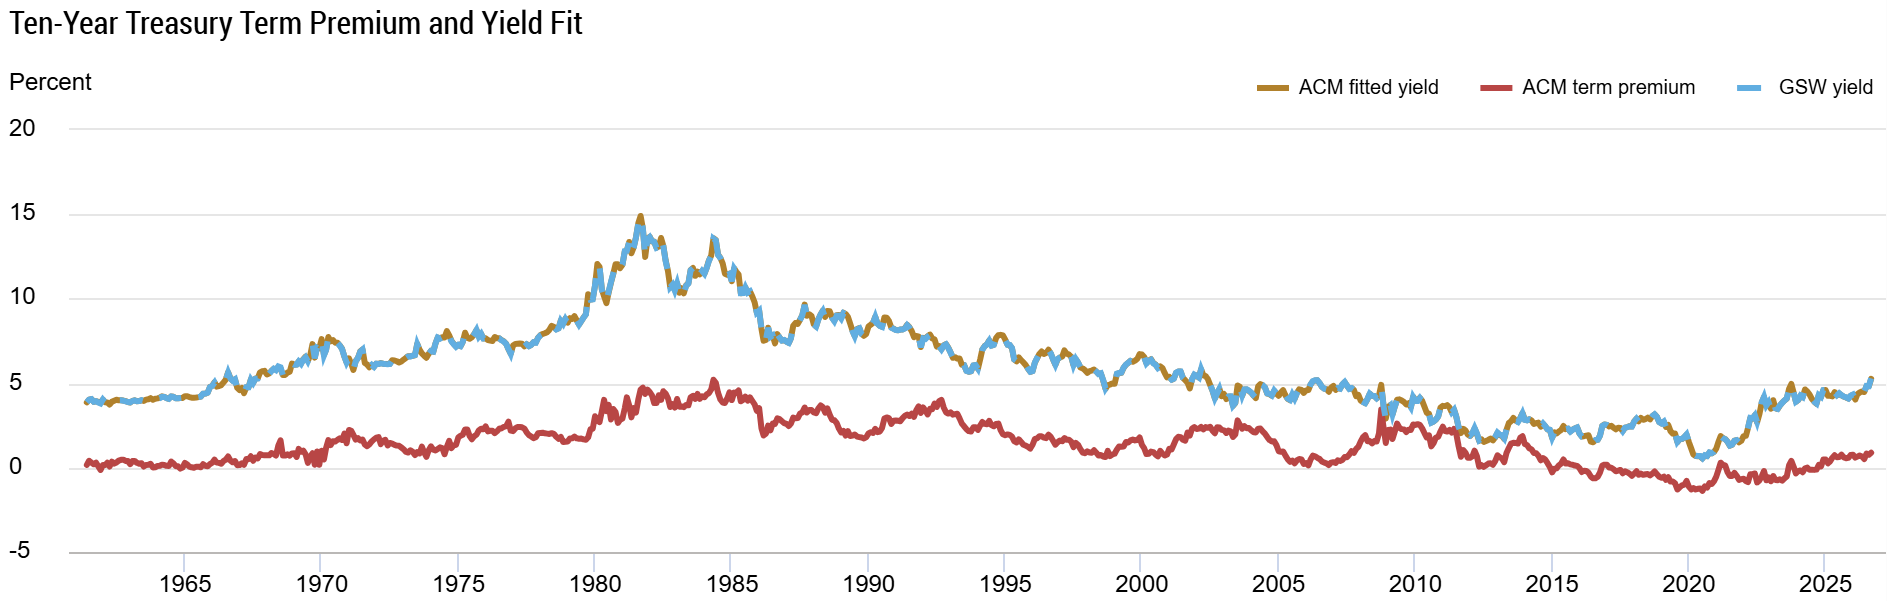
Source: Federal Reserve Bank of New York: Federal Reserve Board. GSW refers to yield data described by Gürkaynak, Sack, and Wright (2007). ACM fitted yield and ACM term premia are obtained from the model described in Adrian, Crump, and Moench (2013). The ACM model is re-estimated once a month. This may result in minor changes to the historical decompositions of Treasury yields.
The decade that subsidised a lot of strategies
This is where a rates statistic turns into a hedge fund problem. A whole family of strategies is built on levering low-volatility assets, and bonds are the obvious one. Risk parity is the clearest example. It weights a portfolio so that each asset contributes the same amount of risk, which leaves it heavy in low-volatility bonds, and then it borrows, usually at around the short-term rate, to lever that bond exposure up to an equity-like level of risk and return. The same basic move runs through levered relative-value trades, curve and carry positions, and large parts of a macro book.
For a decade, that leverage was cheap in two senses at the same time. Financing cost almost nothing, because short rates were near zero. And the asset being levered carried almost no term premium, so you weren't paying much for the duration risk you were piling on. On top of both, bonds reliably rallied when equities fell, so the levered bond leg paid you to hold what amounted to a hedge. Three tailwinds pulling the same way, and every one of them flattered the returns of anything that leaned on them.
What changed, and why it's the price of leverage
All three have turned at once.
The price of leverage, then and now
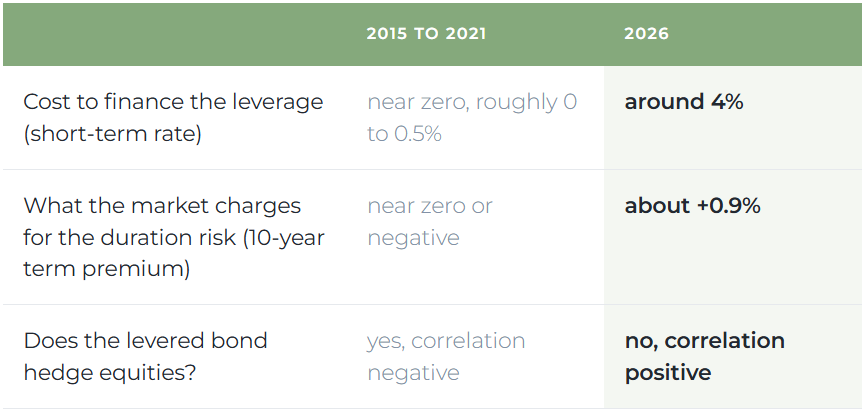 All three have flipped from tailwind to headwind. Figures are approximate and illustrative. Term premium from the NY Fed ACM model; the stock-bond correlation shift is the one we covered in A Sleeve Is Only as Good as Its Regime, and which the IMF has flagged as leaving levered risk-parity books exposed to both legs falling together.
Financing is no longer free. The premium the market charges for duration is back. And the hedge has reversed: since 2020, stocks and bonds have tended to fall together, which means the levered bond leg no longer cushions an equity drawdown, it adds to it.
The direction here is easy to get backwards, so read it slowly. A positive term premium is not, by itself, bad for someone buying bonds. It means you're better paid to hold duration than you were a few years ago. The problem for a levered strategy is what the premium's return is telling you: duration is a real, two-sided risk again, not the near-certainty it looked like when the market demanded nothing to bear it. You're paid more because you're carrying more risk, and a premium that can widen can move against a levered position quickly.
The financing cost and the premium are the two halves of what it costs to run levered duration, and both have risen. You pay more to borrow, and the thing you borrowed against now carries a risk the market insists on pricing. A risk-parity sleeve sized on the 2010s is short two things it used to be paid to be short: cheap leverage and a dependable negative correlation. Both have repriced, at the same time.
What to do with it
None of this means the strategies are broken. Levered duration still has a place, and a positive term premium is a perfectly good reason to be paid for owning bonds outright. The point is a narrower one. The expected risk-adjusted return on levered bond strategies is lower than a backtest drawn from the last fifteen years suggests, and they behave differently in a stress, because the diversification that used to smooth the ride has gone.
So the response is the one we keep returning to. Size the sleeve to the regime you're actually in rather than the average of the past decade, and decide what job the position is there to do before you read its track record (Decide the Role Before You Read the Track Record). Treat the correlation as conditional, not fixed (A Sleeve Is Only as Good as Its Regime). And underwrite the financing itself, because the cost and the availability of leverage is now a live variable rather than a rounding error (Hedge Funds, Repos, and the Hidden Plumbing of Leverage).
Conclusion
Two things could soften this. The term premium is an estimate, so the precise level deserves humility. And it can narrow again. If the Fed stops shrinking its balance sheet, or issuance eases, or inflation settles down, some of the premium could fade, and it has swung around before.
But the durable point doesn't rest on the exact number. For most of the last decade, levering bonds was subsidised from three directions at once, and the subsidy flattered every strategy that leaned on it. The subsidy is gone. What's left is the honest price of borrowing to own duration, and the honest price is higher. Size for that, not for the decade that spoiled you.
Resonanz insights in your inbox...
Get the research behind strategies most professional allocators trust, but almost no-one explains.