
Strategic tail-risk hedging guide: convert volatility into opportunity, cut drawdowns, add crisis alpha, governance rules, instrument mix.
8 min read | Jul 23, 2025
Severe market shocks—the far-left tails of the return distribution—threaten not only short-term performance but the long-run compounding of institutional portfolios. Traditionally, allocators treated tail-risk protection as a grudging cost and tried to minimise the premium spend. A more modern view frames tail hedging as a strategic allocation that converts volatility into opportunity: a cushion during drawdowns, dry powder for re-balancing at cheaper prices, and a structural source of “crisis alpha.” When the hedge is permanent and sized with discipline, the occasional outsized pay-offs can more than offset the modest annual bleed, raising the portfolio’s compound return and reducing the behavioral pressure to de-risk at precisely the wrong moment.
What Counts as a “Tail” in a Multi-Asset World?
A robust program looks beyond equity crashes. Nearly all asset classes exhibit “fat tails” – a greater-than-expected probability of extreme moves. Extreme losses can spring from credit seizures, interest-rate shocks, simultaneous stock-and-bond declines, currency devaluations, commodity spikes, or liquidity freezes. Modern portfolios therefore require a menu of hedges that address multiple macro regimes: deflationary busts, inflationary stagflation, systemic credit events, and sudden correlation breakdowns. The first task for any CIO is to map how each segment of the portfolio—public equity, credit, rates, alternatives—might behave in those scenarios and where the largest fragilities lie.
 Source: Bloomberg, PhaseCapital estimates
Three Frameworks for Integrating Protection
Institutional allocators can integrate tail risk mitigation into their portfolios in several ways. The approach can range from carving out a separate hedging allocation to embedding convex traits throughout the portfolio. Three common frameworks include a dedicated tail-hedge sleeve, a dynamic overlay strategy, and embedded convexity in core holdings:
-
Dedicated Sleeve – A permanent 2–5 % allocation to a tail-risk fund or custom option book. The stand-alone line item will incur steady premiums, but success is measured at total-portfolio level: smaller drawdowns, faster recoveries, and the freedom to stay invested elsewhere.
-
Dynamic Overlay – A derivative overlay that is dialled up or down as valuations and risk conditions change. Rules-based triggers (e.g., implied volatility in lowest decile or credit spreads at cycle tights) help avoid discretionary whipsaws. The aim is to harvest cheap convexity when markets are complacent and monetise hedges when panic drives prices.
-
Embedded Convexity – Allocations to strategies that inherently profit from turbulence, such as long-volatility funds or managed-futures trend followers. These “antifragile” sleeves often deliver positive carry or diversification in benign markets and provide automatic ballast in crises.
Institutions often blend all three, creating overlapping layers of defence that respond to different time horizons and shock types. For example, a pension fund might maintain a small dedicated tail hedge fund allocation, run an overlay selling equity index futures to cut beta during credit crises, and also allocate to a trend-following CTA as part of alternatives.
Selecting the Right Tail Hedge Instruments
With a framework in mind, allocators have a toolkit of instruments to achieve tail protection. Different instruments hedge different risks and carry different costs. Here we compare a few common tail hedge tools and their roles:
|
Risk Factor |
Typical Hedge |
Pay-off Profile |
Carry Considerations |
Practical Notes |
|
Equity crash |
Deep out-of-the-money index puts |
Very convex; near-instant liquidity |
High bleed; roll cost |
Best held continuously in small size or tactically ahead of known catalysts |
|
Credit event |
CDS on broad indices; senior CDX tranches |
Explosive gains once defaults exceed attachment point |
Lower premium than equity puts |
Provides targeted protection against systemic corporate stress |
|
Rate spike / collapse |
Payer or receiver swaptions |
Asymmetric gain if yields breach strike |
Moderate; premiums sensitive to vol surface |
Tailor strikes to inflation- or deflation-risk budget |
|
Volatility shock |
VIX calls, variance swaps |
Gains from vol spike regardless of direction |
Expensive in calm regimes |
Complements directional hedges and captures short, sharp panic moves |
|
Multi-asset crisis |
Managed-futures CTA, long-volatility funds |
Trend capture and long optionality |
Flat to slightly negative carry |
Turn-key solution; diversifies implementation risk |
In practice, allocators compare hedges on three “C-tests”: Cost, Correlation (to portfolio losses), and Convexity (payout acceleration). The most attractive trades deliver the greatest left-tail protection per basis-point of expected drag.
- Cost: Because options and swaps trade in deep, transparent markets, the price of hedging is always easy to assess.
- Correlation: Based on principle assumptions, it involves continuously gauging medium to long-term correlation, depending on multiple scenarios.
- Convexity: A convex hedge gains more in a downturn than it surrenders in an equal upswing—for example, buying protection on a CDX tranche.
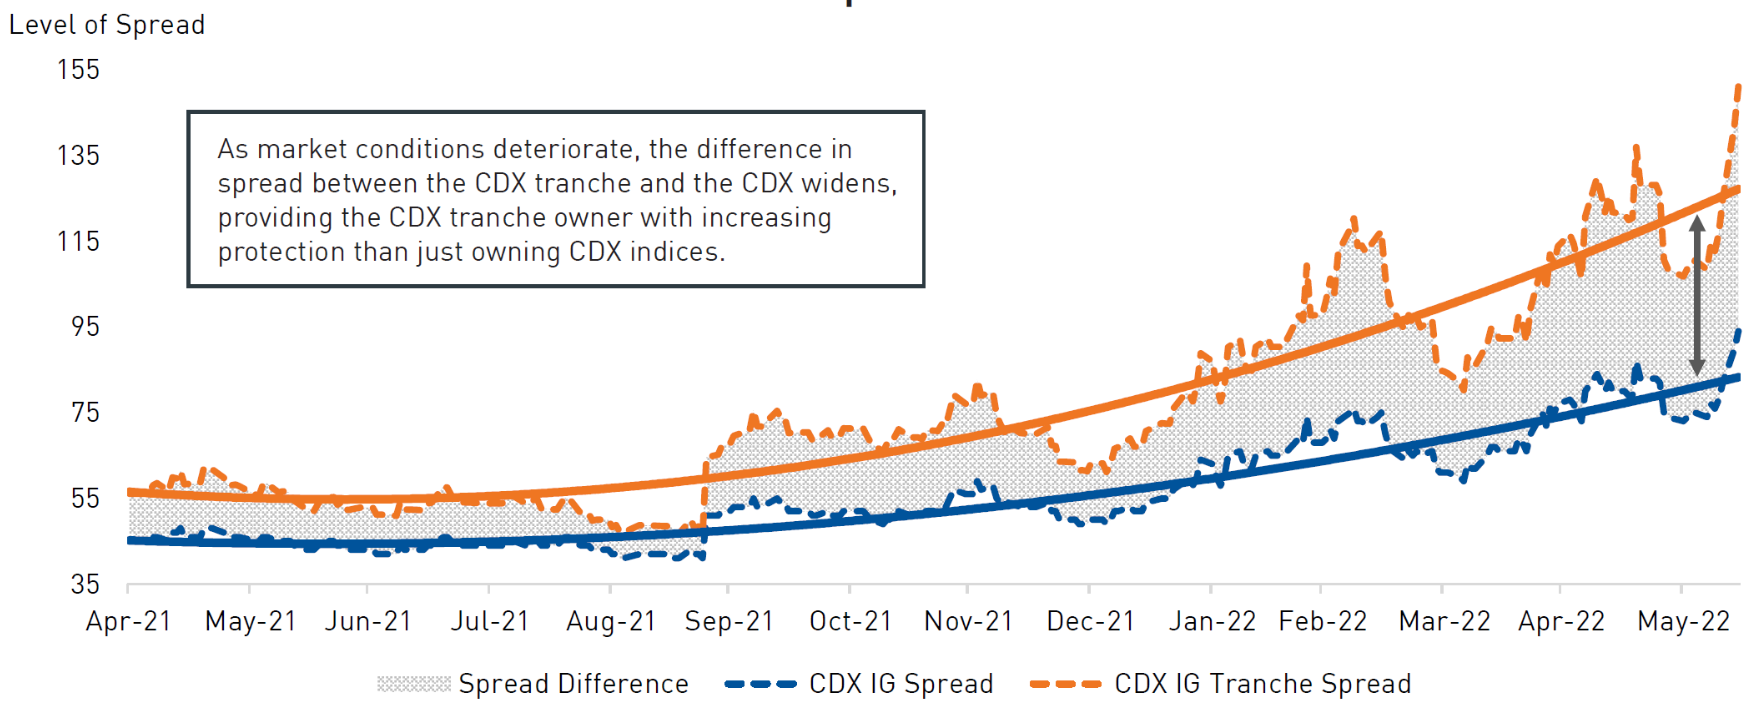
Source: RPIA, Bloomberg, JPMorgan. Data as of June 14th, 2022.
A Decision Framework for Timing and Sizing
Once an allocator has decided to incorporate tail risk hedging, a practical question arises: when should we put on hedges (timing), and how much hedging is enough (sizing)? A strategic program will have some hedges in place at all times, but even then, decisions about scaling up or down will come. Here’s a framework to guide those decisions:
- Diagnose Vulnerabilities – Stress-test the portfolio against equity -30 %, credit-spread +400 bp, and bond-equity correlation +1 scenarios. Rank which shocks drive the worst funding-level outcomes or breach policy limits.
- Set a Budget – Many institutions dedicate 0.5–1 % of portfolio NAV per annum to hedging costs. This budget anchors how much notional can be insured and prevents over-trading during market stress.
- Align Hedge to Scenario – For an inflationary bust, favour payer swaptions or commodity tails; for a deflationary crash, use receiver swaptions and equity puts. Avoid “false friends”: assets that hedge one regime but fail in another.
- Target Partial, Not Total, Protection – Hedging the first 10–15 % of drawdown often secures most of the compounding benefit at a fraction of full coverage cost.
- Buy When You Can, Not When You Must – Build core hedges when implied vol is cheap. Augment tactically using quantitative triggers (e.g., volatility quartiles, credit risk indices) rather than discretionary fear.
- Plan Monetisation – Pre-authorise how gains will be recycled into risk assets or liquidity reserves. Crisis rebalancing is where the hedge translates into long-run outperformance.
Measuring Success
How should institutional investors evaluate a tail risk hedging program’s performance? Traditional asset management metrics (like standalone return or Sharpe ratio of the hedge position) are inadequate here. By nature, a tail hedge will often show negative returns in normal times – but that doesn’t mean it’s failing. The real test is how the hedged portfolio performs through full market cycles. Key metrics and considerations include:
- Drawdown Reduction – Peak-to-trough loss and time to breakeven for the total portfolio.
- Downside Volatility – VaR and CVaR improvements at 95–99 % confidence levels.
- Incremental Contribution to Compound Return – Did the presence of hedges lift the portfolio’s post-crisis ending value relative to an unhedged path?
- Pay-off Efficiency – Crisis-period hedge gains divided by cumulative premiums paid.
- Behavioural Benefit – Qualitative evidence that stakeholders stayed invested and rebalanced rather than capitulating.
One important principle: Do not judge the hedge in isolation. Reporting should present the hedged and unhedged portfolio side by side so trustees see the net impact rather than fixating on the hedge sleeve’s negative carry.
Common Pitfalls and How to Avoid Them
|
Pitfall |
Why It Happens |
Mitigation |
|
Cancelling programme after years of carry drag |
Performance myopia; pressure to cut “dead weight” |
Set multi-year evaluation horizon; remind committee of insurance analogy |
|
Over-hedging at peak fear |
Emotional reaction, expensive premiums |
Use pre-defined budget caps; scale gradually |
|
Hedging wrong risk (basis mismatch) |
Using S&P puts for global equity book, or bonds for inflationary crash |
Map exposures accurately; run scenario correlations |
|
Liquidity crunch from collateral calls |
Under-funded margin accounts |
Hold cash/T-bills reserve or use funded options |
|
Complexity exceeding governance capacity |
Esoteric structures, opaque managers |
Favour transparent, liquid instruments; demand clear reporting |
Conclusion
By making tail protection a standing allocation, investors flip the narrative from “hedging is a drag” to “hedging funds future offence.” In calm periods, the cost is a predictable premium. In crises, the hedge provides both capital and psychological stability: it generates liquid gains when other assets are illiquid or crashing, enabling re-investment at depressed valuations. Over a full cycle, that convex profile can widen the portfolio’s return distribution on the right (opportunity capture) while truncating the left tail (ruin avoidance).
The result is an antifragile portfolio—one designed not merely to survive shocks but to emerge stronger. Such resilience is increasingly valuable in a world of regime shifts, geopolitical surprises, and policy volatility. Institutions that systematise tail-risk hedging position themselves to preserve purchasing power, meet obligations, and seize eventual dislocations that less-prepared peers must shun
Resonanz insights in your inbox...
Get the research behind strategies most professional allocators trust, but almost no-one explains.