
October QIS was flat overall but highly dispersed: equity factors broadened, rates reversed and credit weakened as systematic leadership shifted.
8 min read | Nov 3, 2026
October reversed most of September’s strongest systematic themes. September had paid rates momentum and rates convexity as sovereign yields repriced sharply higher. In October, Rates Momentum fell 1.77% and Rates Long Volatility lost 0.96%.
Equity factors improved a lot, though momentum did not drive it. Low volatility, growth, quality and value all performed strongly, which points to a broader rotation under the surface. Every credit composite finished negative.
In aggregate the QIS universe was roughly flat, but the spread between composites was wide. Dispersion across the visible composites was close to 3.9 percentage points, from +2.11% for the strongest strategy to -1.77% for the weakest. Equity Factors were the strongest area, averaging roughly +0.5% across the visible strategies. Momentum averaged around -0.4%, Hedging around -0.5% and Value around -0.4%. Carry was broadly flat on average, with large differences between asset classes. The returns came from different places than in September.
Rates stayed restrictive and stress stayed contained.
Macro conditions stayed tight. Energy and raw-material prices remained elevated after the strikes in Iran, and headline inflation ran above core. In September, US CPI was 3.7% and euro area inflation 3.8%, against core readings of 2.6% and 2.5%. Long-term yields stayed high: the US 10-year was just above 5% and the German 10-year 3.4%.
The policy impulse is what changed. The Fed raised rates in September and held the target range at 3.75% to 4.00% on 28 October. The ECB, which raised in June and September, held at 2.50% the next day. Both said their next move depends on the strength and duration of the energy shock. Activity gave them room to wait. The Fed described US growth as solid, the ECB called the euro area economy resilient in the second quarter, and the OECD projects 2026 growth of 2.2% for the US and 1.0% for the euro area.
Market stress stayed low. US equity indices are at record highs, the VIX closed the month at 17.2, near its long-term level, and systemic stress indicators in the US and euro area are back at pre-war levels. Valuations differ by region: the Shiller CAPE ratio, a cyclically adjusted price-earnings measure, is 39.6 in the US and 23.1 in Europe.
Credit and European sovereigns were the exceptions. High-yield spreads, which had narrowed for more than a year, widened strongly over the month to 349 basis points in euros and 314 in dollars. The French 10-year yield reached 4.9%, above Italy at 4.5%. Political unrest and a deficit above 5% of GDP pushed the French spread over Bunds to roughly 155 basis points.
This combination helps explain why October rewarded equity breadth and hurt the rates trade and credit premia. These are our readings of the data and do not prove cause.
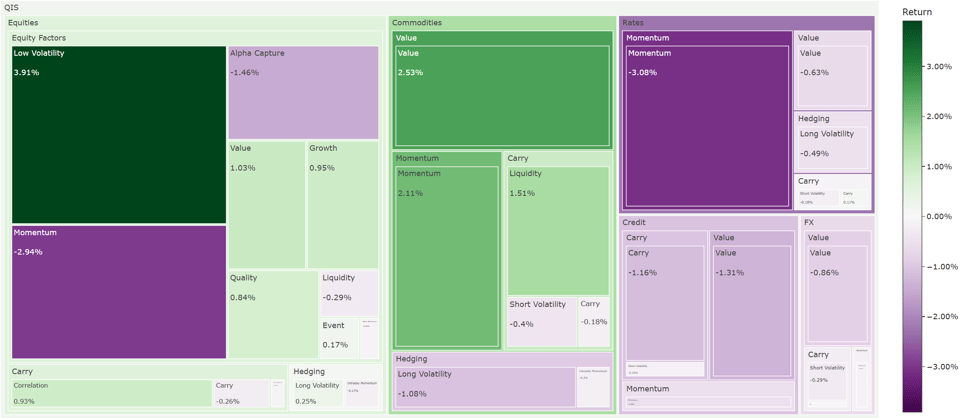
Equity breadth returned, but momentum did not lead it
Equities Low Volatility gained +2.11%, the strongest composite in the October dashboard. Growth returned +1.44%, Quality +1.01% and Value +0.79%. ESG, Event, Liquidity and Size were also positive. Equities Momentum lost 0.66%.
Growth and Low Volatility can both perform while Momentum struggles only if leadership is rotating inside the market. That looks like a rotation with a wider opportunity set than the narrow momentum regime of September.
The macro setting makes this easier to read. With volatility near normal and stress subdued, short volatility and correlation premia tend to get paid. Equities Short Volatility gained +1.16% and Correlation +0.74%, while Equities Carry declined 0.52%. High rates keep the valuation hurdle high, which can favor earnings quality and defensiveness over a simple extension of the prior winners. Valuations vary widely across regions, so growth and value both had room to work. Momentum is the factor most exposed when leadership rotates.
October rewarded several equity characteristics at once and penalized the strategy most dependent on yesterday’s winners staying winners.
Rates gave back September’s trade
September’s two dominant QIS trades, Rates Momentum and Rates Long Volatility, had gained +4.40% and +4.10%. In October they fell 1.77% and 0.96%. Rates Carry, Short Volatility and Value were also negative, and the rates complex lost roughly 0.7% on average.
The regime stayed restrictive, but the trade that captured the initial repricing stopped paying. September’s repricing came with rising inflation and rate increases. In October both central banks held, and their next step depended on an energy shock with an unclear path. The Fed’s September projections still pointed to another 25 basis points in 2026, so the direction stayed open. Trend and convexity strategies need a persistent move, and a market waiting for the next data point tends not to provide one.
October did not erase September’s gains, but it shows the path dependency in trend and volatility strategies. A regime can be read correctly and still become a poor trade once the price adjustment has happened.
Carry and value may also have met European sovereign stress. Where implementations hold European government bonds, wider spreads in France and other highly indebted countries are a risk that standard carry and value signals do not anticipate.
Credit lost money across every composite
All five credit composites lost money, averaging roughly -0.94%. Credit Long Volatility fell 1.46%, Credit Value 1.14%, Credit Carry 1.07% and Credit Momentum 0.80%. Even Credit Short Volatility was slightly negative at -0.23%.
The breadth of the losses matters more than any single number. Earlier in 2026, credit was often one of the cleanest environments for systematic carry and short-volatility premia. In October, none of carry, value, momentum or convexity gave meaningful protection.
The macro link looks plausible. Credit was absorbing a high risk-free rate and a wider spread at the same time, which is hard for carry, value and momentum together. Attractive all-in yields do not protect a systematic premium once the spread cushion starts to erode. Credit Long Volatility also lost, which suggests a steady widening from historically tight levels rather than a sharp dislocation. Convexity pays on sharp dislocations, and a steady widening can cost premium without a payoff.
Carry became asset-specific
Carry split by asset class in October. Equity short volatility did well, consistent with a calmer VIX. Commodity carry stayed constructive even with energy and raw-material prices still disrupting the inflation picture: Commodities Liquidity gained +0.44%, Carry +0.32% and Short Volatility +0.26%. Credit Carry lost 1.07%, Rates Carry declined modestly and FX Carry was also negative.
FX Intraday Momentum lost 1.16%. The euro fell to about 1.11 against the dollar on gas prices and political uncertainty in Europe, and headline-driven moves can reverse within the day, which works against intraday trend signals.
The same premium can behave very differently in equity volatility, commodity curves, credit spreads or currencies. October rewarded selective carry rather than carry as a blanket allocation.
Top and bottom performers
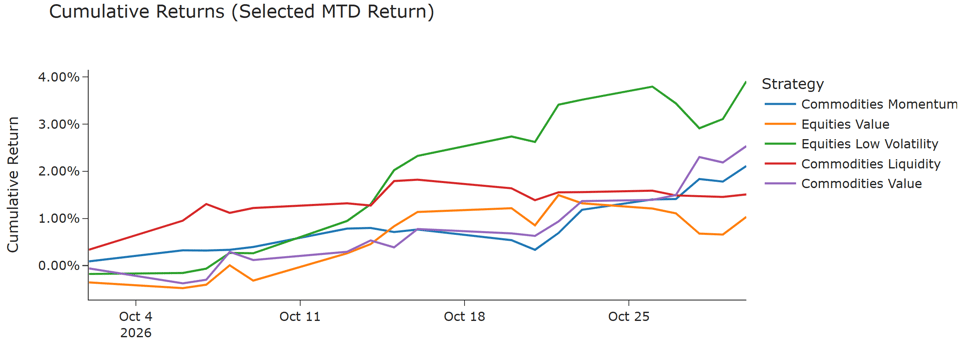
Top five: Equities Low Volatility (+2.11%), Equities Growth (+1.44%), Equities Short Volatility (+1.16%), Equities Quality (+1.01%) and Equities Value (+0.79%).
Bottom five: Rates Momentum (-1.77%), Credit Long Volatility (-1.46%), FX Intraday Momentum (-1.16%), Credit Value (-1.14%) and Credit Carry (-1.07%).
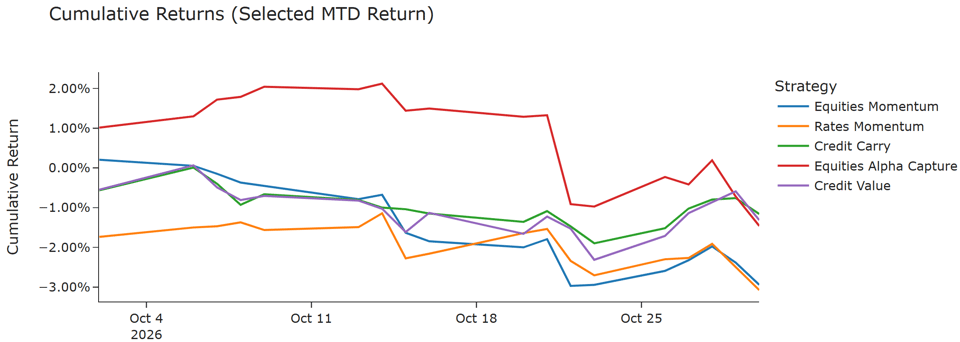
Equity diversification paid in October. September’s rates trend and broad credit premia did not.
What we take into November
October reinforces a theme from much of 2026: the useful unit of analysis is the asset-class implementation of a premium, not the premium label. Momentum can work in commodities and fail in rates and equities, and carry can perform in equity volatility and commodity curves while losing in credit. Long volatility can add value in one market and bleed in another.
The year-to-date dashboard shows the same split. Leadership is scattered across Credit Short Volatility, Equities ESG and Growth, Commodities Momentum and Equity Size, and the largest losses sit in FX Intraday Momentum, Credit Long Volatility, FX Long Volatility and Rates Carry. That dispersion is a feature of the QIS opportunity set.
The macro calendar frames what comes next. The ECB meets on 26 November and the Fed on 9 December, and both have tied their decisions to the energy shock. If energy prices ease and both stay on hold, rates trend signals may again find little to follow. If the shock deepens and tightening resumes, September’s rates trade could return quickly. For credit, continued widening may keep carry and value under pressure, while stabilization could let the cushion rebuild.
The question for November is where the next persistent regime will emerge, and whether the implementation is positioned to capture it before the market rotates again.
Resonanz insights in your inbox...
Get the research behind strategies most professional allocators trust, but almost no-one explains.