
Multi-PM platforms are popular for stability and performance. Firms have varying AuM, employee count, and PM team size.
4 min read | Nov 24, 2022
Multi-PM platforms were not always popular, particularly due to their high pass-through fees, however they have gained prominence over the recent number of years due to their stability and performance. In this post, we look at 32 multi-PM platforms to study if there is any relationship between the year that they were founded, their AuM, and their employees.
Current AuM of Multi-PM platforms
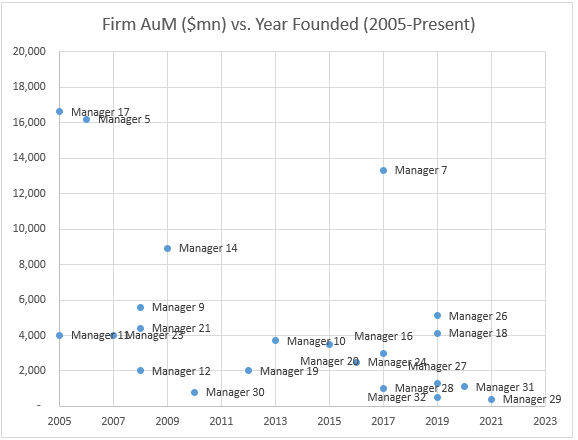
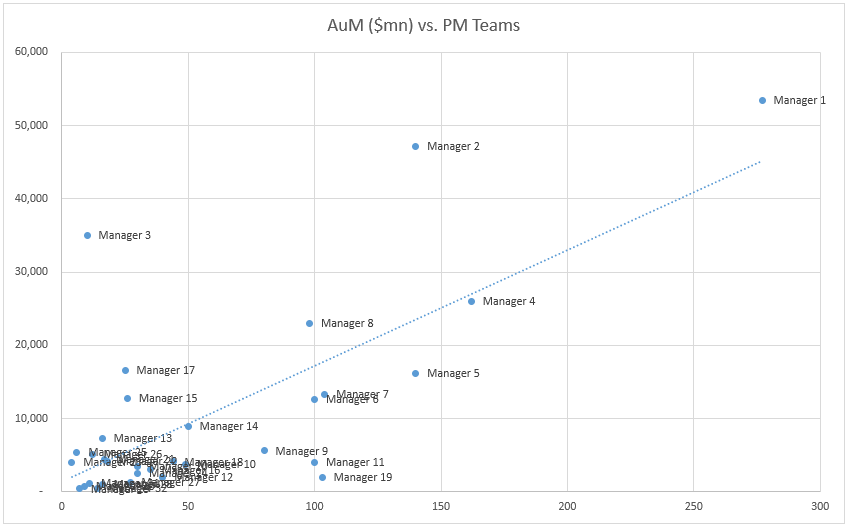
The two charts below compares the year that the firm was founded and its current AuM for two periods, namely 1980 to 2022 and 2005 to 2022 (allows for visibility). Based on the charts, there are 3 periods that have a higher number of multi-pm launches: 1988-1992 (6), 2005- 2009 (8), and 2017-2017 (7). The 1988-1992 periods shows a clear distinction between the managers that were able to take advantage of the rich opportunity set in the 1990s to become the behemoths that they are today (Manager 1, Manager 2, and Manager 3). Manager 4 could potentially have grown to be as large, however they were faced with regulatory issues in the early 2010s, which forced them to manage only internal capital for a number of years. Even though Manager 22, Manager 6, and Manager 13 were founded during the same period or earlier, they were unable to grow as large. The second chart shows that Manager 7 was the fastest growing hedge fund that launched post GFC by a wide margin. Of those that launched post GFC, they are the only manager to exceed the $10bn mark.


By Employee…
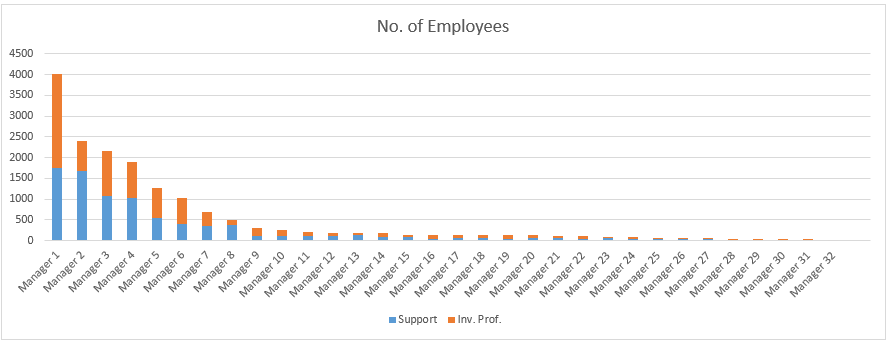
Naturally, firms that have the most AuM tend to hire the highest number of people as shown in the chart below. 51% of the total employees hired by the 32 firms work at the top 3 largest firms by headcount, while 70% work at the top 5 firms as seen in the chart below.
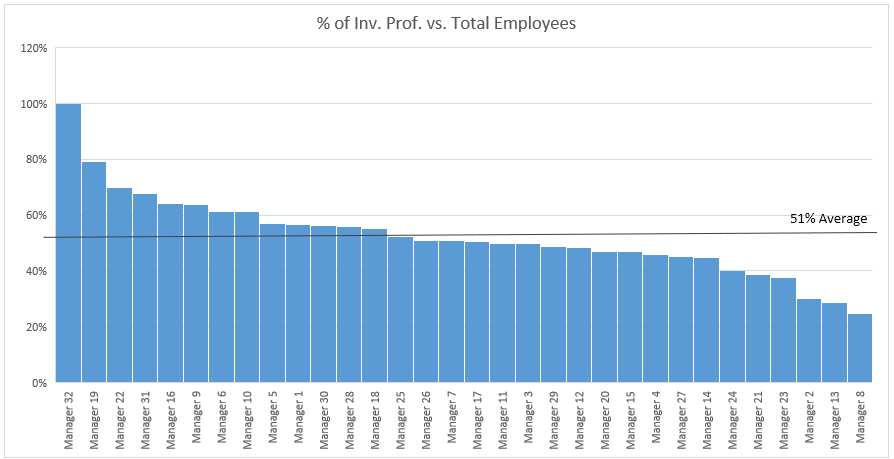
The chart below shows than on average 51% of the employees working at a firm are investment professionals. Most firms have a ratio between 40%-60%. The clear outlier is Manager 32 that has only investment professionals, however, this is because they utilise resources from their parent company that are not shown in the chart. Manager 32 should reflect similar statistics to Manager that is also managed by the same parent company, however, they have their own operations team (Finance, Ops, Legal, Compliance, and Technology).
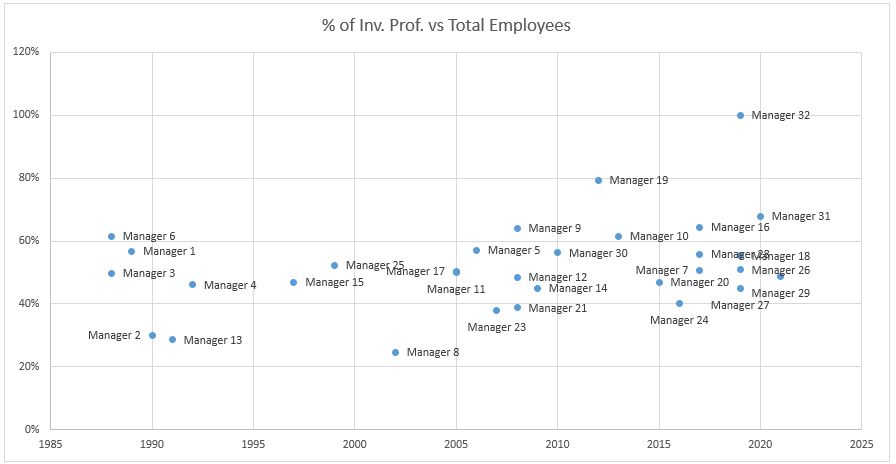
The chart below includes the year that the firm was founded as an additional dimension. However, there is no trend between the proportion of investment professionals and the year the the firm was launched.
On average, the AuM per employee is approximately $35mn (does not account for over allocation by a fund). The main outlier is manager 17.

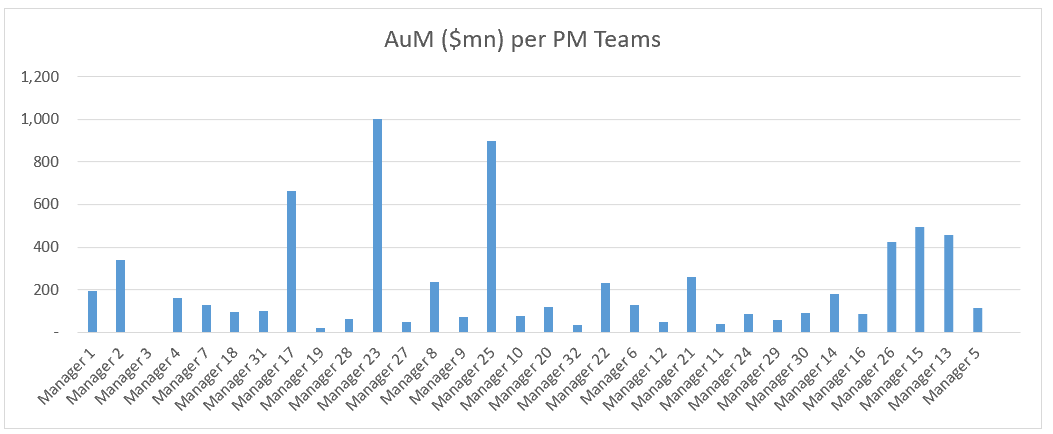
By PM Team…
On average, each PM team manages approximately $225mn (does not account for overallocation by a fund). Some manage significantly less, however this is not abnormal as these funds tend to be smaller in size. However, the outliers towards the upside include Maanger 3 ($3.5bn per team, not shown in the chart due to the high number), Manager 17, Manager 23, and Manager 25. The deviation is mostly because these firms have a one team per strategy approach with multiple underlying PMs. For Manager 17, their higher level of AuM per PM team is peculiar.
By Investment Professional…
On average, each investment professional manages approximately $72mn (does not account for over allocation by a fund). The outliers include Manager 17, Manager 8, and Manager 15. Manager 8 and Manager 15 could have a higher allocation per investment professional as large positions can be taken per investment professional due to the depth of the markets traded. Again Manager 17 stands out as well, however there is no clear explanation.

Key Takeaways
- Of the surviving/prominent multi-PM funds, 21 out of 32 were launched during 1988-1992 (6), 2005-2009 (8), and 2017-2017 (7).
- Across the platforms, there is a consistent ratio of AuM to employees, PM teams, and investment professionals.
- In terms of AuM per employee and investment professional the largest managers ( Manager 1, Manager 2, and Manager 3) fall at the lower end of the spectrum.
- Manager 17 seems to be quite lightly staffed in terms of employees, PM teams, and investment professionals. No clear reason can be found.
Resonanz insights in your inbox...
Get the research behind strategies most professional allocators trust, but almost no-one explains.