September extended the Q3 pattern: income‑oriented carry and targeted momentum produced the most consistent gains, while defensive equity factors, FX Value, and rates hedges under‑delivered. With dispersion moderate and bucket‑level correlations still contained, we continue to favor a balanced allocation that leans into carry (equity/credit), complements with momentum/alpha‑capture, and sizes hedges for risk control rather than return generation as we head into Q4.
BLOG
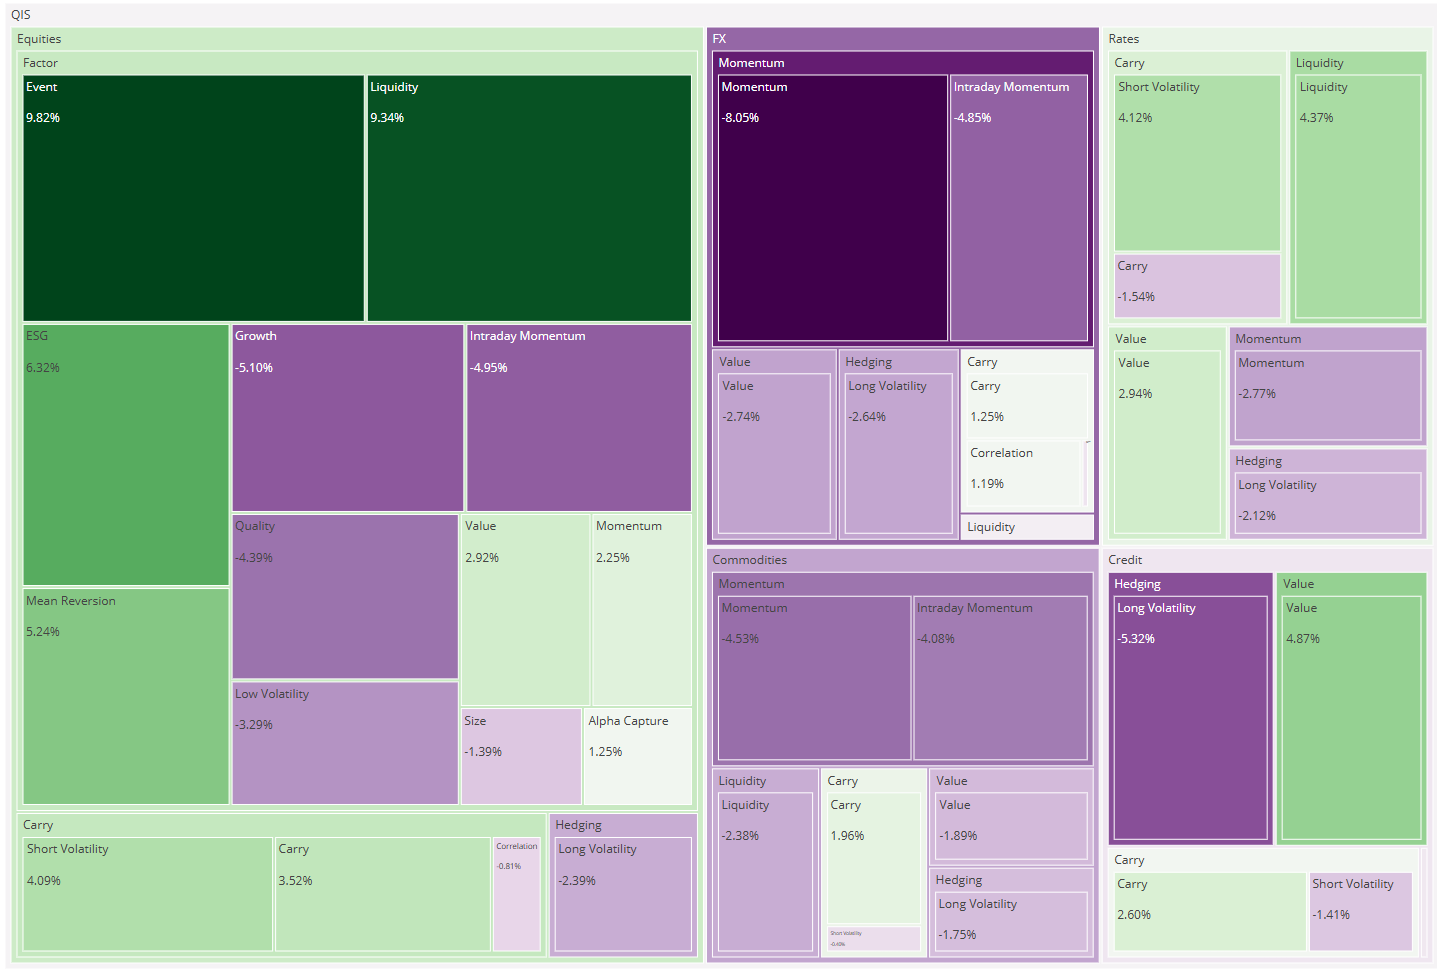
QIS strategies saw modest gains in September 2025, with strong performance in equity and credit carry and momentum, despite challenges in defensive equities and commodity strategies.
4 min read | Oct 6, 2025
Executive Summary
September 2025 was mixed but modestly positive for quantitative‑investment strategies (QIS). The average composite returned +0.26% MTD, with 20 of 42 strategies (≈48%) finishing higher. Cross‑sectional dispersion widened to ~5.8 ppts (best +3.13% vs worst ‑2.63%). Leadership came from Carry (especially equity and credit short‑volatility) and Momentum (equities and credit), while Hedging and Liquidity detracted. By asset class, Credit was the standout; Rates was the sole laggard with all six rates sleeves negative.
Market Context
Global equities advanced again in September as the first Fed rate cut of the year supported risk appetite. Short‑dated yields fell while long‑dated rates stayed elevated, steepening curves. Credit spreads tightened and equity volatility stayed contained. Commodities diverged: gold surged to new highs even as oil fell on oversupply concerns. The U.S. dollar softened into month‑end.
This backdrop maps neatly to the QIS cross‑section. A rising, breadth‑improving equity tape supported equity Momentum and alpha‑capture stock‑selection, while tighter credit spreads aided credit Carry and credit Momentum. Curve steepening and event‑driven rate swings created a poor realised‑vs‑implied mix for rates hedging and even rates short‑vol. In FX, a softer dollar helped FX Momentum, but broad moves compressed FX Value premia. In commodities, gold’s spike and oil’s slide lifted commodity long‑vol at the margin but complicated liquidity and intraday momentum signals.
Top- and Bottom-Five Composites (MTD)

Top performers
-
Alpha Capture (Equities – Factor): +3.13% — stock‑selection alpha led the equity style complex.
-
Momentum (Equities – Factor): +2.30% — trend continuation as leadership re‑concentrated in winners.
-
Short Volatility (Equities – Carry): +2.15% — theta harvest in a contained‑vol equity regime.
-
Short Volatility (Credit – Carry): +2.06% — tight spreads and benign skew supported carry.
-
Momentum (Credit – Momentum): +1.95% — incremental spread tightening rewarded trend followers.
Bottom performers
-
Long Volatility (Rates – Hedging): ‑2.63% — premium bleed as rate swings failed to offset cost.
-
Quality (Equities – Factor): ‑2.32% — rotation away from “steady earners.”
-
Low Volatility (Equities – Factor): ‑1.71% — defensive tilt lagged in a risk‑seeking tape.
-
Value (FX – Value): ‑1.57% — valuation premia compressed across key pairs.
-
Liquidity (Commodities – Liquidity): ‑1.23% — microstructure headwinds amid divergent gold/oil moves.

Average Performance by Thematic Bucket
-
Carry: +0.95% (9/12 positive) — the month’s strongest bucket. Equities Short‑Vol (+2.15%) and Credit Short‑Vol (+2.06%) led; Rates Short‑Vol (‑0.92%) was the soft spot amid two‑sided curve moves.
-
Momentum: +0.70% (4/6 positive) — Equities Momentum (+2.30%) and Credit Momentum (+1.95%) outweighed Commodities Intraday Momentum (‑0.67%).
-
Factor: +0.08% (5/12 positive) — Alpha Capture (+3.13%) offset Quality (‑2.32%) and Low‑Vol (‑1.71%); style rotation remained brisk.
-
Value: ‑0.22% (1/4 positive) — Credit Value (+1.28%) couldn’t overcome weakness in FX/Commodities/Rates Value.
-
Hedging: ‑0.55% (1/5 positive) — only Commodities Long‑Vol (+0.54%) was up; Rates Long‑Vol (‑2.63%) led losses.
-
Liquidity: ‑0.68% (0/3 positive) — FX Liquidity (‑0.64%) and Commodities Liquidity (‑1.23%) detracted; Rates Liquidity (‑0.17%) was only marginally negative.
Average Performance by Asset Class
-
Credit: +1.32% (4/5 positive) — carry and momentum drove gains; long‑vol was a small drag. The month’s spread tightening and steady primary markets aligned with the outperformance.
-
Equities: +0.39% (8/16 positive) — Alpha Capture, Momentum, and Short‑Vol offset Quality/Low‑Vol weakness in a rising, low‑vol equity tape.
-
FX: +0.26% (4/8 positive) — Momentum (+1.60%) and Carry (+1.14%) benefited from dollar softness; Value (‑1.57%) lagged as valuation gaps compressed.
-
Commodities: +0.14% (4/7 positive) — Momentum (+1.89%) and Long‑Vol (+0.54%) helped, but Liquidity (‑1.23%) detracted in choppy microstructure.
-
Rates: ‑0.82% (0/6 positive) — curve steepening and event risk left Long‑Vol (‑2.63%) and Short‑Vol (‑0.92%) both under water; Rates Value (‑0.07%) was least negative.
Conclusion
Resonanz insights in your inbox...
Get the research behind strategies most professional allocators trust, but almost no-one explains.