January 2026 revealed sharp dispersion in quantitative strategies, with momentum outperforming and commodity carry struggling amid policy-driven volatility.
4 min read | Feb 2, 2026
January 2026 was a good reminder of a core truth in systematic investing: headline market strength does not guarantee broad-based performance.
Risk assets advanced and sentiment remained constructive, but under the surface the market was shaped by policy-driven repricing, commodity curve dislocations, and cross-asset volatility transmission. The result was a month where outcomes across quantitative investment strategies (QIS) diverged meaningfully—rewarding strategies aligned with the prevailing regime while penalizing those exposed to adverse convexity.
A flat month hiding significant dispersion
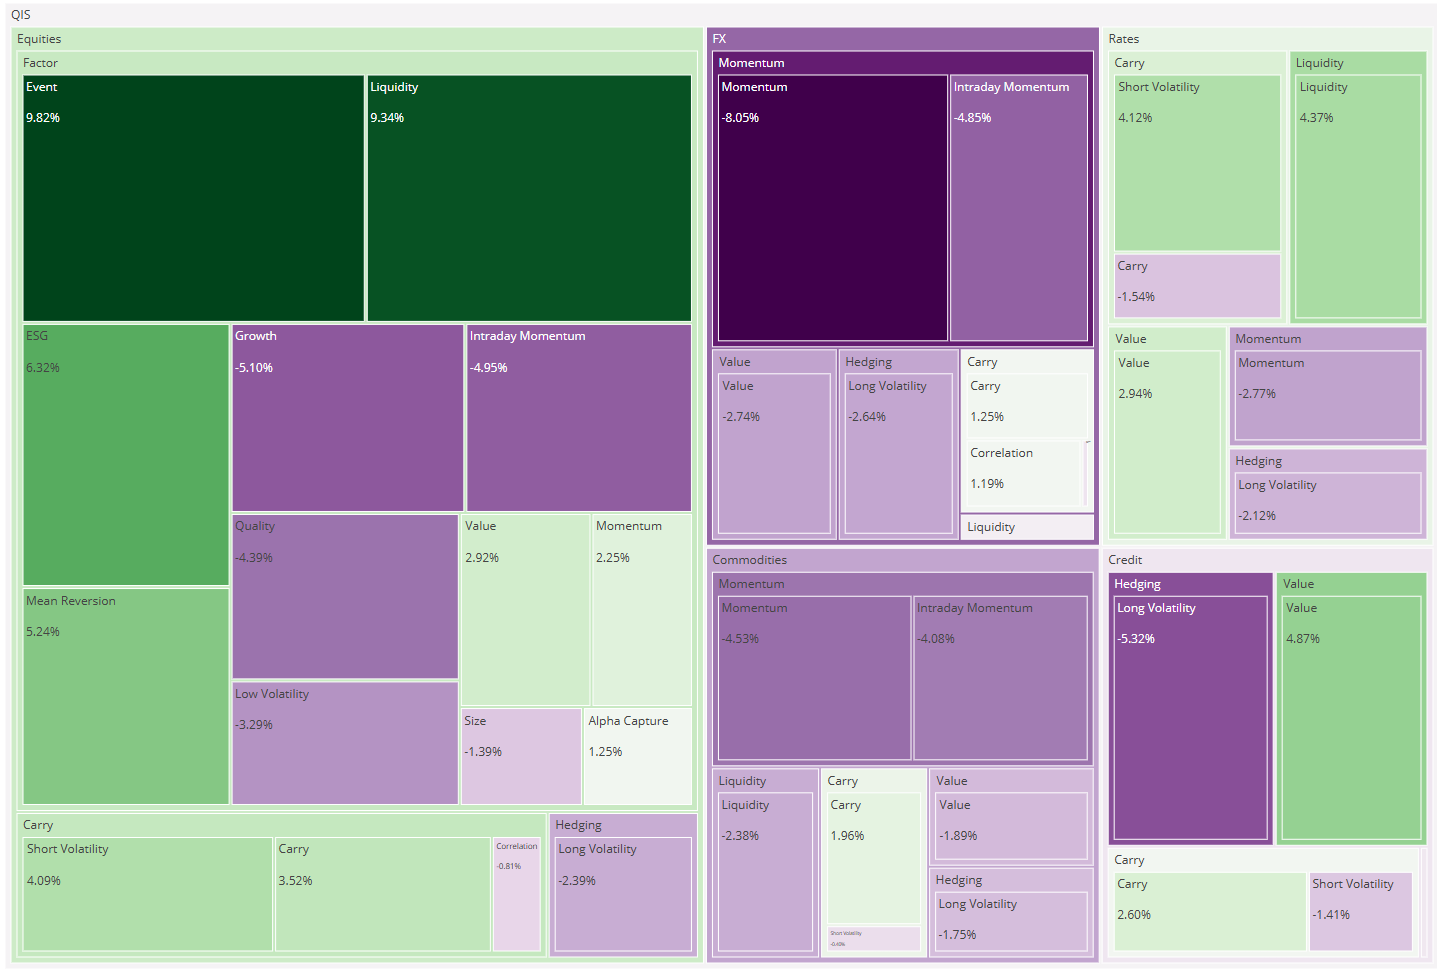
On average, QIS composites finished January broadly flat (+0.01%). Roughly half of strategies posted positive returns, but dispersion was elevated at around 8 percentage points. In other words, this was not a month where “everything worked a little”—it was a month that clearly differentiated between strategies.
Broadly speaking:
- Momentum and convex strategies delivered positive contributions.
- Carry and short-volatility exposures, particularly in commodities, drove most of the drawdowns.

What shaped the market environment
Markets entered 2026 with a constructive tone, supported by ongoing AI capex enthusiasm and a Federal Reserve that kept policy unchanged at its late-January meeting. Beneath the surface, however, several regime-defining forces were at work.
Policy-related headlines triggered sharp repositioning across assets, most visibly in FX and precious metals. At the same time, stress in Japan’s super-long government bond sector spilled over into global duration markets, increasing rates volatility and reducing trend persistence.
Commodities became a second major transmission channel. A weather-driven spike in U.S. natural gas distorted front-end curves and volatility, while gold and silver reversed sharply late in the month after earlier strength. This combination—rates volatility, commodity curve convexity, and shifting FX expectations—is precisely the type of environment where systematic outcomes tend to diverge.
Where performance was generated
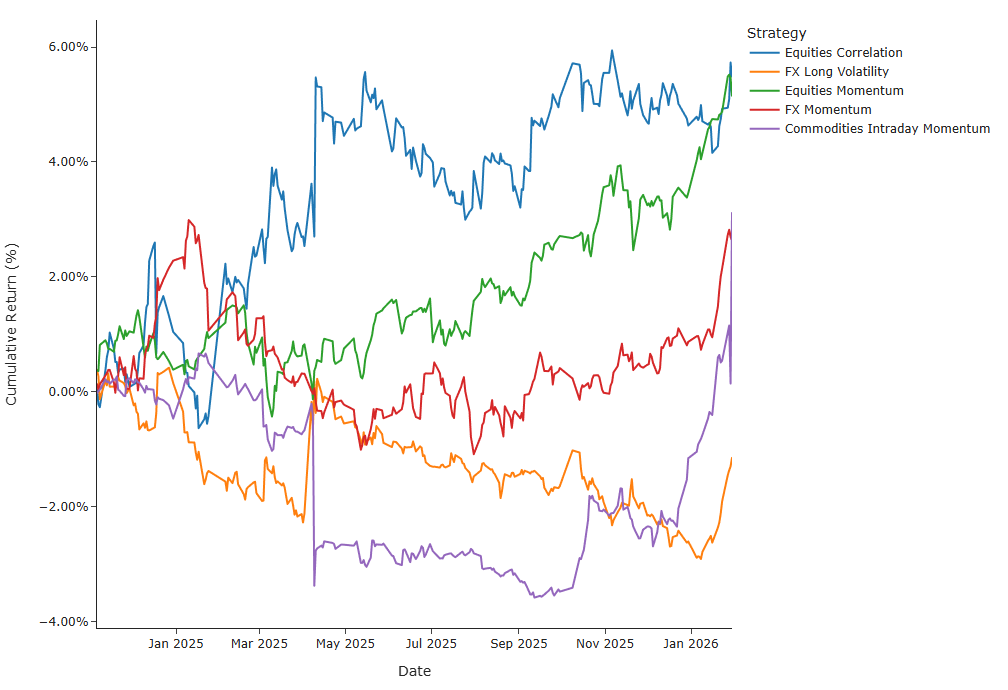
Momentum strategies were the most consistent contributors, delivering +0.63% overall.
- FX momentum (+1.74%) benefitted from persistent policy- and rate-differential-driven currency trends.
- Commodities momentum (+0.78%) captured large absolute moves and rotations, particularly around energy.
- Credit momentum (+0.29%) contributed modestly amid stable spreads.
Alongside momentum, defensive and convex strategies delivered as intended, contributing +0.45% without requiring a broad risk-off environment.
FX long volatility (+1.49%) monetized increased dispersion, while commodities intraday momentum (+4.32%)—the strongest individual composite—captured realized volatility during sharp commodity dislocations at month end.
Top-five performers (MTD)
Where performance was challenged
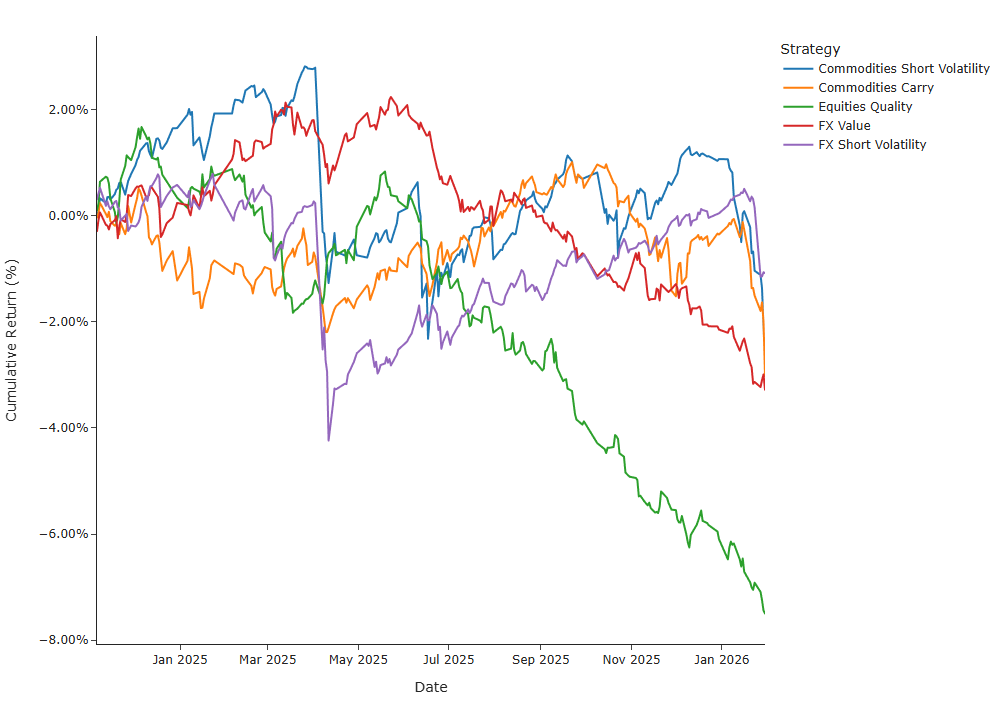
Carry strategies delivered mixed results, with outcomes highly dependent on asset class.
In rates and credit, short-volatility carry performed well, supported by orderly markets and contained spread volatility. In commodities, however, the picture was very different. Commodity carry (–2.67%) and commodity short volatility (–3.76%) suffered meaningful drawdowns as front-end energy shocks and abrupt reversals punished short-convexity exposures.
Value strategies were modestly negative overall (–0.14%), primarily due to FX value (–1.16%), as policy-driven currency moves persisted longer than typical mean-reversion horizons.
Equity factor performance was flat in aggregate (+0.02%) but internally dispersed. Momentum and growth continued to benefit from participation, while defensive tilts such as quality lagged in a risk-supportive environment.
Bottom-five performers (MTD)
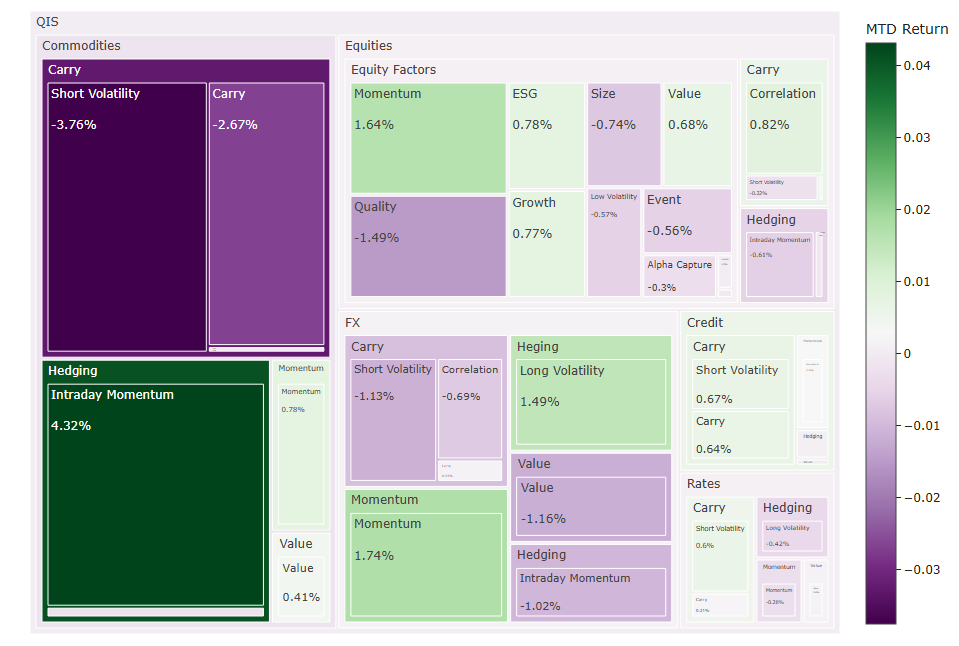
How the picture looked by asset classes
-
Credit: +0.34% – Supported by stable spreads and carry.
-
Rates: +0.05% – Slightly positive, despite internal volatility.
-
Equities: +0.01% – Flat overall, masking factor dispersion.
-
FX: –0.09% – Winners offset by value and short-vol losses.
-
Commodities: –0.17% – Highly bifurcated outcomes.
A tale of two commodity regimes
January’s commodity results were especially instructive. Strategies designed to capture volatility and trends performed strongly, while those reliant on curve stability and mean reversion struggled. This bifurcation highlights a recurring theme in systematic portfolios: commodities can be powerful diversifiers, but they demand careful convexity management.
What this means for systematic portfolios
January reinforced an important lesson for investors allocating to quantitative strategies: regime awareness matters more than directional conviction.
Cross-asset volatility transmission—from Japan’s rates market to FX and commodities—created an environment where diversification across signals and explicit convexity played a critical role. Momentum and selective hedging strategies benefitted, while short-convexity carry exposures, particularly in commodities, required caution.
Looking ahead
Markets appear increasingly sensitive to policy credibility, positioning, and cross-asset linkages. This backdrop suggests continued opportunities for momentum and selective convex strategies, while underscoring the need for disciplined risk management around carry and short-volatility exposures.
In systematic investing, months like January are not anomalies—they are reminders that how returns are generated matters just as much as how much is generated.
Resonanz insights in your inbox...
Get the research behind strategies most professional allocators trust, but almost no-one explains.