Selective risk appetite, increased volatility, and macro-driven trades. Carry strategies excelled, while equity growth lagged amid AI and inflation narratives.
4 min read | Mar 2, 2026
February marked a clear change in tone versus January’s optimistic start: risk appetite became more selective, volatility rose, and markets increasingly traded a “macro + AI narrative” rather than a simple earnings impulse. For systematic strategies, this translated into broader positive breadth and lower dispersion than January, with leadership concentrated in carry and select equity styles.
Across the QIS composite universe, the average strategy returned +0.37% MTD, with 65% finishing positive. Dispersion was moderate (~3.0 percentage points)—the best performer gained +2.15%, while the weakest was –0.82%. Year-to-date (Jan–Feb), the average composite is +0.45%, with 58% of strategies positive.
Market backdrop and why it mattered for QIS
February’s macro regime was unusual in an important way: equities softened while bonds rallied sharply, despite a hot inflation print late in the month—consistent with a growth-scare narrative taking hold. U.S. equities ended mixed to negative (Dow slightly positive, S&P down, Nasdaq materially lower), with losses concentrated in long-duration growth/tech. In contrast, Europe advanced strongly and Japan rallied sharply, highlighting a widening regional and sectoral dispersion.
Three market features mattered most for QIS returns:
- AI dispersion and valuation sensitivity: the market increasingly differentiated “AI winners vs. losers,” penalizing parts of software and long-duration growth even when earnings were strong.
- Rates as a hedge again: U.S. yields fell materially into month-end (10-year to ~3.97%, 2-year to ~3.38%), which supported certain carry profiles and challenged trend signals in rates and credit.
- Commodity normalization after January’s dislocations: the extreme front-end natural gas premium from late January largely retraced, and precious metals stabilized at elevated levels—conditions that often favor carry and short-volatility after a prior month of convexity shocks.

What the QIS tape said in February

1) Carry reasserted leadership
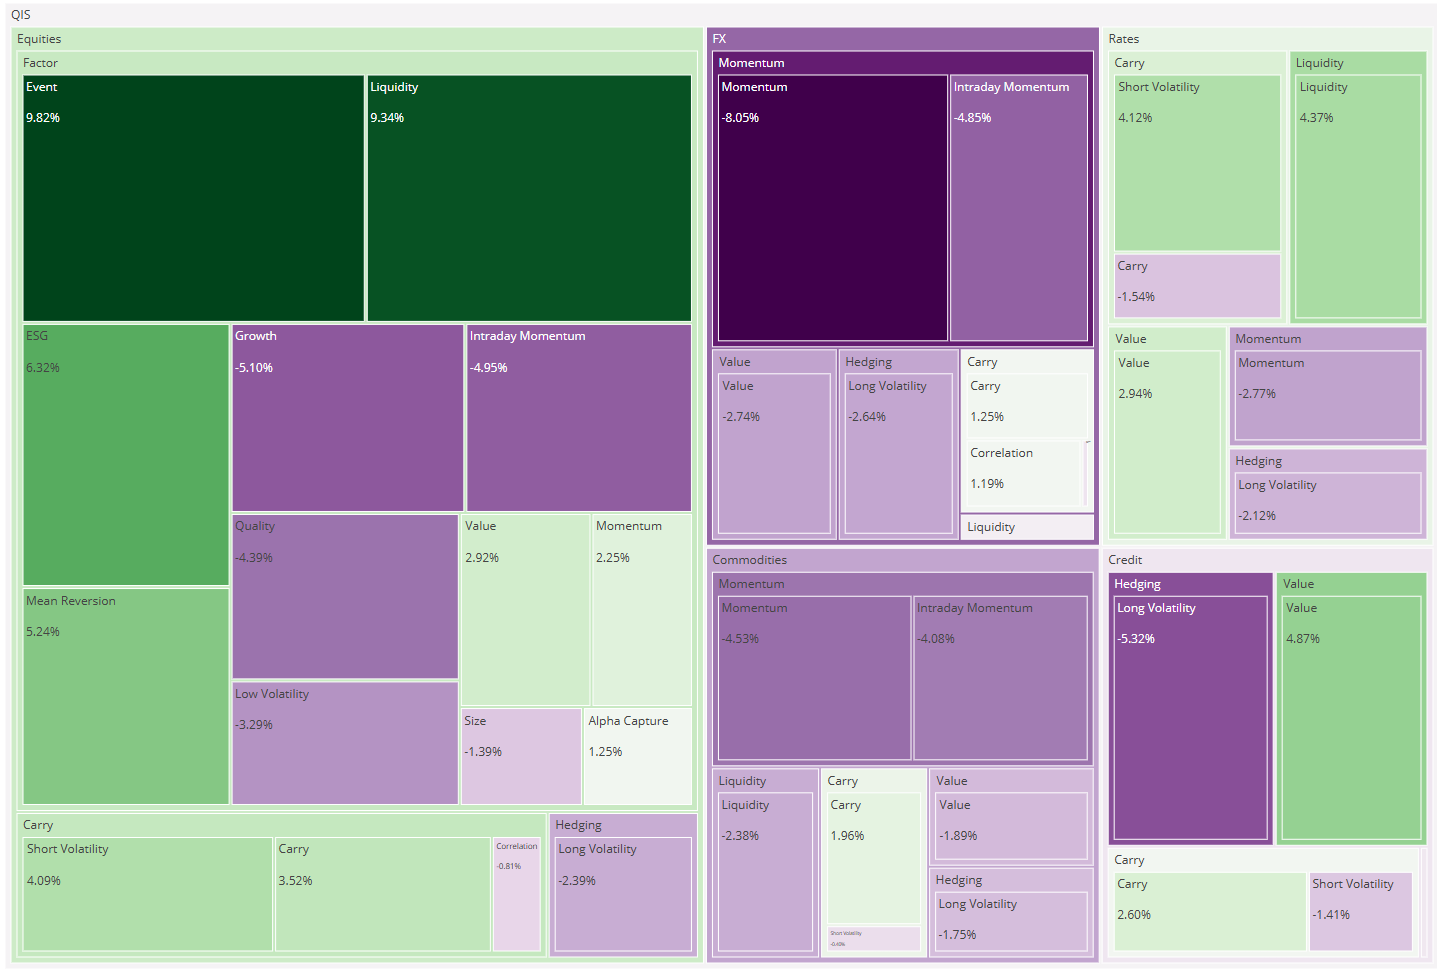
At the bucket level, Carry was the clear winner (+0.86%), with all 13 carry composites positive—a strikingly broad outcome. The pattern was consistent with a month where realized volatility and curve dynamics were less hostile than January’s shock regime:
-
Commodities Carry (+2.15%) led the entire universe, consistent with curve normalization after the gas spike and a more orderly commodity tape.
-
Commodities Short Volatility (+1.47%) also performed strongly, suggesting implied premia remained attractive relative to realized outcomes after January’s turbulence.
-
FX Carry (+1.00%) provided additional support in an environment with still-favorable carry differentials.
2) Equity styles reflected the “AI rotation”
Equity Factors were solid (+0.43%), but the dispersion inside the bucket was the story. Strategies aligned with “defensive + rotation” dynamics did well:
-
Equities Low Volatility (+1.52%) benefited from the market’s late-month caution and higher volatility.
-
Equities Momentum (+1.41%) remained resilient, consistent with continued cross-sectional leadership and regional divergence (Europe/Japan strength versus U.S. tech weakness).
-
By contrast, Equities Growth (–0.82%) lagged—directionally consistent with the market’s reassessment of long-duration AI/tech exposures.
3) Momentum was mixed: commodities worked, credit didn’t
While Commodities Momentum (+0.81%) was positive, the Momentum bucket overall was slightly negative (–0.09%), as three sleeves detracted:
-
Credit Momentum (–0.64%) was one of the month’s weakest composites, consistent with a regime where spreads remain historically tight but “growth scare” dynamics and rate moves can disrupt trend persistence.
-
FX Momentum (–0.29%) and Rates Momentum (–0.24%) also struggled, reflecting choppier narrative-driven markets.
4) Hedging was slightly negative overall
Hedging finished marginally negative (–0.08%), with gains concentrated in commodity convexity:
-
Commodities Intraday Momentum (+0.96%) and Commodities Long Volatility (+0.58%) contributed positively—consistent with ongoing dispersion across commodity complexes.
-
Meanwhile, FX Long Volatility (–0.60%) and Equities Intraday Momentum (–0.59%) detracted, suggesting volatility in FX and intraday equity microstructure was not consistently monetizable relative to carry cost and signal noise.
Top-five performers (MTD)

-
Commodities Carry: +2.15%
-
Equities Correlation: +1.56%
-
Equities Low Volatility: +1.52%
-
Commodities Short Volatility: +1.47%
-
Equities Momentum: +1.41%
Bottom-five performers (MTD)

-
Equities Growth: –0.82%
-
Credit Momentum: –0.64%
-
FX Long Volatility: –0.60%
-
Equities Quality: –0.60%
-
Equities Intraday Momentum: –0.59%
Conclusion
February’s QIS results reflected a market that became more selective and more narrative-driven, with performance shaped by AI dispersion, a late-month inflation surprise, and an unusual rates rally consistent with growth-scare pricing. In that regime:
- Carry was the most reliable premium, particularly in commodities and across short-volatility implementations.
- Equity styles rewarded defensiveness and rotation-awareness, while growth exposure lagged.
- Trend was not uniformly supported: commodities momentum worked, but credit/rates/FX momentum were challenged by reversals and tight valuations.
With dispersion moderate and breadth improving, February looked less like a “shock month” and more like a regime transition—one where systematic diversification across carry, defensive equity premia, and selective trend exposures remains essential as the market continues to trade macro narratives rather than a single dominant growth story.
Resonanz insights in your inbox...
Get the research behind strategies most professional allocators trust, but almost no-one explains.