December felt like the kind of month that often gets overlooked: low volumes, little drama, and a market that largely chose to end the year without forcing a fight. But for systematic strategies, these “quiet” months can be deceptively informative—because the absence of big headlines makes the underlying regime easier to read.
On average, QIS strategies gained +0.28% in December, with 60% of composites finishing positive. Dispersion was moderate at ~2.5 percentage points—not a month of extreme winners and losers, but still enough differentiation to reward exposures aligned with the year-end macro setup.
And that setup was fairly clear: a supportive central-bank backdrop, contained volatility, steady risk appetite, and a commodity tape defined more by relative winners and losers than by a single broad trend.
The Market Backdrop That Shaped December
December delivered a calm finale to a strong year for global markets. Trading volumes were light, a late-month Santa rally briefly pushed U.S. equities to new highs, and central banks reinforced a dovish tone. The Fed delivered its third 25bp cut of the year at its mid-December meeting and signaled a likely pause into early 2026 as inflation continued to cool but remained above target.
Across assets, the signals were consistent with a late-cycle “soft landing” regime:
-
Equities were steady but choppy beneath the surface.
-
Rates were range-bound at the long end, with front-end pricing still sensitive to policy expectations.
-
Credit remained well supported as spreads stayed tight and issuance remained strong.
-
Commodities continued their 2025 divergence: precious metals remained strong while energy stayed pressured.
-
The dollar stayed weak into year-end, reinforcing a major 2025 macro trend.
In other words: macro wasn’t dramatic—but it was directional enough to show up in systematic returns.
Where the Strength Came From
December’s leadership was concentrated in two buckets: Momentum and Carry.
1) Momentum worked—cleanly and broadly
Momentum returned +0.79%, with every sleeve positive. That breadth matters: it wasn’t one lucky trade or one asset class doing the lifting.
The late-year environment—policy easing, stable risk appetite, and clear relative winners across commodities and credit—tends to be supportive for trend models. In particular:
-
Commodities momentum was strong (+1.45%) as dispersion between metals and energy created a cleaner trend landscape.
-
Credit momentum also contributed, consistent with stable spreads and constructive carry conditions.
2) Carry delivered exactly what it’s supposed to
Carry was up +0.57% with 10 of 13 sleeves positive, led overwhelmingly by credit:
This is a classic late-year “premium harvesting” regime: contained stress, stable spreads, and enough calm to let carry strategies monetize the premium without interruption.
…And Where It Didn’t
The month wasn’t without weak spots, but the story was less about broad drawdowns and more about persistent structural headwinds:
FX remains challenging for value and convexity
FX ended December down -0.13%, primarily due to:
This fits the broader year: valuation-driven mean reversion and long-volatility have struggled in an environment defined by persistent dollar weakness, regime stability, and convexity cost.
Equity factors were flat—but internally messy
Equities finished essentially flat (+0.07%), but the factor map was sharply split:
This echoes a defining feature of 2025 QIS: equity factor outcomes were driven less by “equity beta” and more by factor dispersion and rotation.
Top- and Bottom-Five Composites (MTD)
December’s extremes provide a clean window into the regime
Top performers

-
Commodities Intraday Momentum: +1.70%
-
Credit Short Volatility: +1.70%
-
Credit Carry: +1.63%
-
Commodities Momentum: +1.45%
-
Equities Value: +1.10%
Bottom Performers

-
FX Value: -0.76%
-
FX Long Volatility: -0.72%
-
Equities Low Volatility: -0.64%
-
Commodities Long Volatility: -0.64%
-
Equities Quality: -0.58%
The mapping is intuitive: carry + trend + credit strength on one side; long-vol cost and FX valuation mean reversion on the other.
How the Picture Looked by Asset Class

Breaking it down reinforces the same story:
-
Credit (+1.17%) was the clear winner—every sleeve positive.
-
Commodities (+0.78%) performed strongly (6/7 positive), powered by intraday/trend signals.
-
Equities (+0.07%) were flat with large internal factor dispersion.
-
Rates (-0.02%) ended slightly negative—range-bound and mixed.
-
FX (-0.13%) lagged as value and long-vol detracted.
Year-End Review: What Defined QIS in 2025
If December was a calm conclusion, 2025 as a whole was a year where QIS behaved exactly as it should in a regime-driven world: dispersion mattered, premia behaved differently across assets, and the “average return” did not capture the reality of the opportunity set.
On average, QIS strategies finished +0.16% YTD (median +0.10%) with 52% of composites positive. But the headline masks a key truth:
2025 was not a “beta year” for QIS—it was a dispersion year.
The gap between best and worst strategies was ~14.4 percentage points.
What worked in 2025
-
Carry was the most consistently rewarded bucket (+1.23% avg YTD).
Policy easing, stable growth, tight spreads, and benign defaults created an ideal credit-carry environment.
-
Credit was the strongest asset class (+1.65% avg YTD).
Strong technicals and spread compression supported both carry and short-volatility premia.
-
Selected equity premia worked exceptionally well.
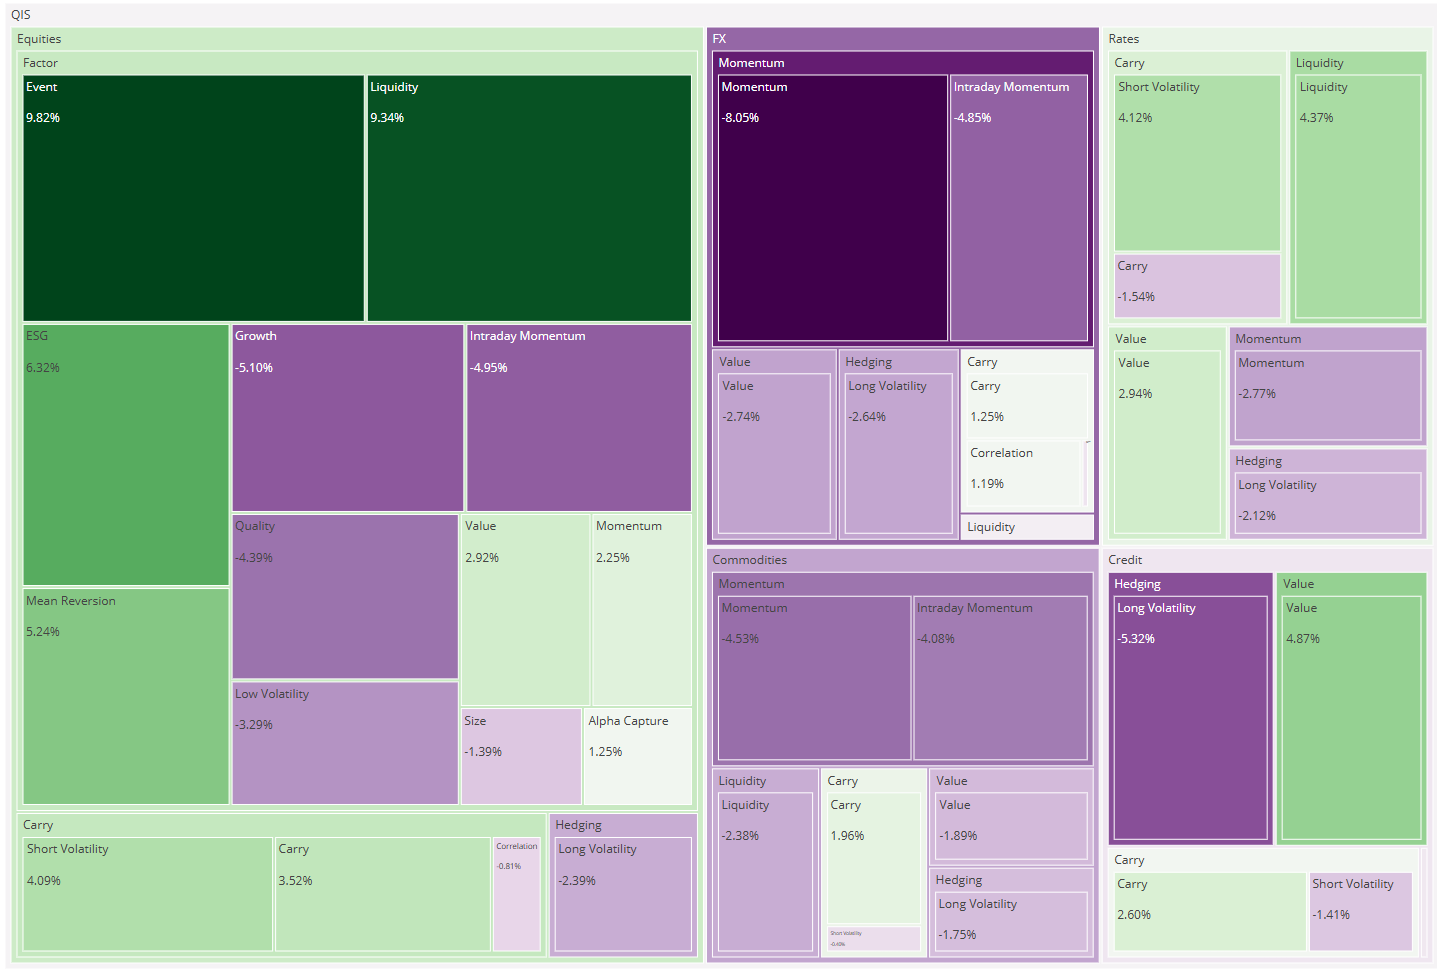
The top YTD performers included:
-
Equities Event: +7.99%
-
Credit Value: +6.19%
-
Equities Value: +5.42%
-
Equities ESG: +4.46%
What struggled in 2025
-
Hedging was the weakest bucket (-2.24% avg YTD).
In a year where risk assets were broadly strong and volatility stayed contained for long stretches, convexity cost dominated.
-
Some equity styles experienced persistent headwinds.
-
Equities Quality: -6.36%
-
Equities Size: -4.93%
-
Equities Growth: -4.07%
-
Rates momentum and long-volatility were difficult.
Shifting policy expectations and curve regime changes created an unstable trend backdrop
What It Means Going Into 2026
If you take one thing from December—and from 2025—it’s this:
The regime rewarded monetised premia (carry, short-volatility, selected trends), and punished the cost of convexity unless volatility arrived on schedule.
That has two practical implications:
-
Carry remains a powerful building block, particularly in credit, but should be sized with respect to tail risk.
-
Hedges remain essential, but 2025 again shows that convexity is rarely “free”—it needs to be budgeted and structured intentionally, not relied upon as a steady return source.
December didn’t change the story—it confirmed it. In a world where policy is easing and the cycle remains resilient, systematic strategies continue to do what they do best: translate regime into return, as long as investors stay diversified across premia and avoid over-anchoring to a single factor narrative.