Historically there is a very direct way to benefit from the end of an interest rate hiking cycle.
3 min read | Aug 31, 2023
The Historic Context
The U.S. Treasury yield curve hit its deepest inversion in July since Fed Chairman Paul Volcker's high inflation era. The inversion illustrates financial market fears that a continued Fed hiking cycle sends the United States into recession.
The highly scrutinized spread between the 2-year and 10-year U.S. Treasury note yields, has been inverted for a full year now, and hit the widest point since 1981 at -109.50 in early July, a deeper inversion than during the March SVB banking crisis.
A yield curve inversion, in which shorter-dated Treasuries trade at higher yields than longer-dated securities, has been a reliable signal of upcoming recessions. The 2/10 year yield curve has inverted six to twenty-four months before each recession since 1955, according to a 2018 report by researchers at the San Francisco Fed, offering only one false signal in that timeframe.
The Consensus
Indications of strength in the U.S. economy have prompted market participants to price in additional rate hikes this year to keep inflation in check. In addition, financial markets largely continue to echo bullish sentiment with the S&P 500 up nearly 20% year to date and low volatility evidenced by a mid-teens VIX. Futures markets which had previously priced in rate cuts this May, now reflect the first cut will come in January.
Contrarian Views
However, recent economic metrics and record options market activity imply the economy is not so robust as to defy an inverted yield curve’s historical precedent. A salient example is the spread between U.S. corporate bankruptcy filings and high yield spreads. Court filings for bankruptcies have only been higher twice this century during the pandemic and GFC. Yet to date, high yield spreads have not kept pace.
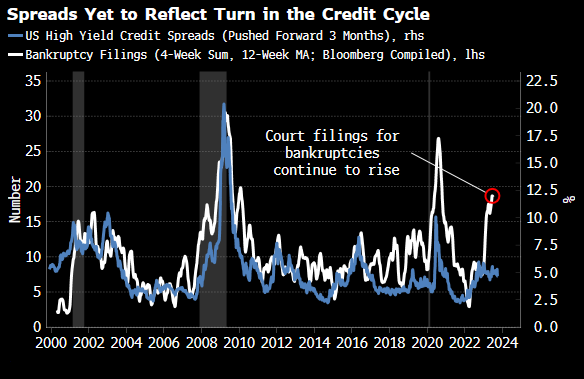
Source: Bloomberg
Recent market activity also indicates record levels of open interest in the iShares 20+ Year Treasury Bond ETF (TLT). Roughly 2.7 million call option contracts are held by investors, a new record according to CBOE data. That's nearly double the total a year ago, and more than triple the 800,000 or so put contracts outstanding. This is sizeable aggressive positioning when the ETF is trading around 100 and the largest bets require reaching $130 or $135 per share.
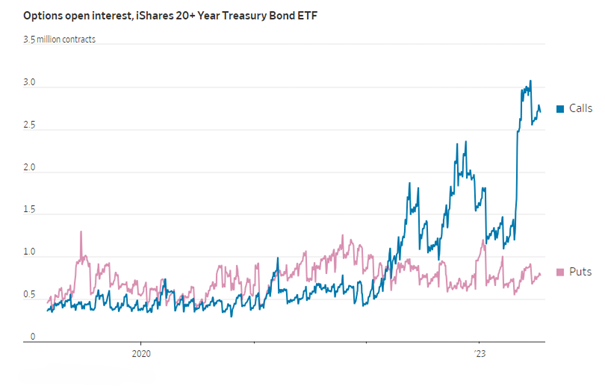
Source: CBOE Data
The Takeaway
Mark Twain said, “History doesn’t repeat itself, but it does rhyme.” It’s unclear if a recession is imminent. Historically, yield curve inversion is powerful indicator for recession within six to twenty-four months of occurrence. Financial markets remain well inside this precedent window.
The spread between court bankruptcy filings and high yield or the record open interest in bond call options certainly garners attention. However, as dynamic as CDS protection or derivatives can be, timing outcomes with decaying instruments in open ended systems like financial markets is a complex difficult endeavor.
A more conservative approach also carries significant historic precedent. Specifically, long maturity treasuries don’t decay, and also outperform after Fed hiking cycles end. Since 1995, this post cycle duration outperformance has widened with both the term structure and the passage of time.
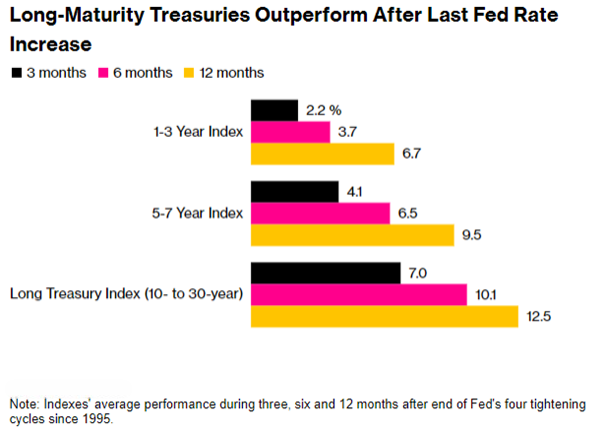
Source: Bloomberg
There is no such thing as a free lunch.
It’s quite possible to be early buying treasuries as well, although mark to market can recover better than decaying or expiring derivatives. The confluence of an inverted yield curve and the historic efficacy of long duration at the end of a hiking cycle is a powerful precedent tandem.
Portfolios should consider increasing duration in these market conditions.
Resonanz insights in your inbox...
Get the research behind strategies most professional allocators trust, but almost no-one explains.