
How much should liquid and illiquid alternatives weigh in your SAA? A constraint-driven guide for institutions and private wealth investors.
11 min read | Jan 5, 2026
Strategic Asset Allocation has been a running theme in our research this year. In “Strategic Asset Allocation: 6 Practical Frameworks for Better Decisions”, we laid out the core playbook: different ways investment committees can design long-term policy mixes, from classic mean-variance optimization to factor-based, endowment-style and liability-aware frameworks. In “Implementing MVO: How Investment Committees Turn Theory into Practice”, we then moved from whiteboard to boardroom, showing how to turn those frameworks into real portfolios under governance, data and implementation constraints.
From there, “The 60/40 Illusion: Rethinking Portfolio Resilience in a Changed World” challenged the idea that a static 60/40 can still serve as an all-weather benchmark for SAA, arguing instead for modular, more resilient architectures that explicitly carve out space for diversifying strategies and real assets. And in “Total Portfolio Approach: A Holistic Framework for Modern Asset Allocation”, we stepped beyond traditional SAA altogether, asking what happens when every position – public or private, hedge fund or index fund – is forced to compete for its place in a single, unified portfolio.
Taken together, those four pieces answer three big questions: "How should we think about SAA conceptually? How do we actually implement it? And what changes when we adopt a Total Portfolio mindset?"
What they do not fully answer is the question most CIOs, family offices and investment committees eventually circle back to:
"How big should the alternatives and hedge fund allocation really be, once constraints are taken seriously?"
That is where this new post picks up. We look at SAA through a constraint-driven lens. Instead of asking whether alternatives “deserve a slice”, we ask: "Given your liquidity needs, leverage policy, peer and benchmark risk, and fee and complexity budget, how much capital does your SAA actually want in liquid and illiquid alternatives? And what roles should hedge funds play inside that sleeve?"
The blog post that follows tries to give a practical, numerate answer. We map out a unified set of building blocks for traditional assets, liquid alternatives and private markets; show how different constraint sets change the “optimal” weight in alternatives; and sketch realistic corridors for institutions and sophisticated private-wealth investors.
1. From “Should we use alts?” to “How much?”
In our earlier pieces, alternatives and hedge-fund-like strategies were discussed as extra risk premia intended to improve diversification (factor-based SAA), tools to repair the vulnerabilities of 60/40 in e.g. inflationary regimes, and natural components in a TPA world where every strategy must “earn its place”.
We aim to define a broad, realistic opportunity set (e.g. traditional assets, liquid alts, illiquid private markets), make explicit assumptions for long-term returns, Sharpe ratios and correlations and then impose constraints on e.g. tracking error, fees, leverage and illiquidity.
Alternatives are no longer a rounding error. Global private capital (private equity, venture, private debt, real estate and other real assets) has grown from low single-trillion levels in 2006 to the mid-teens in USD trillions by 2024, with a roughly ten percent compound annual growth rate.
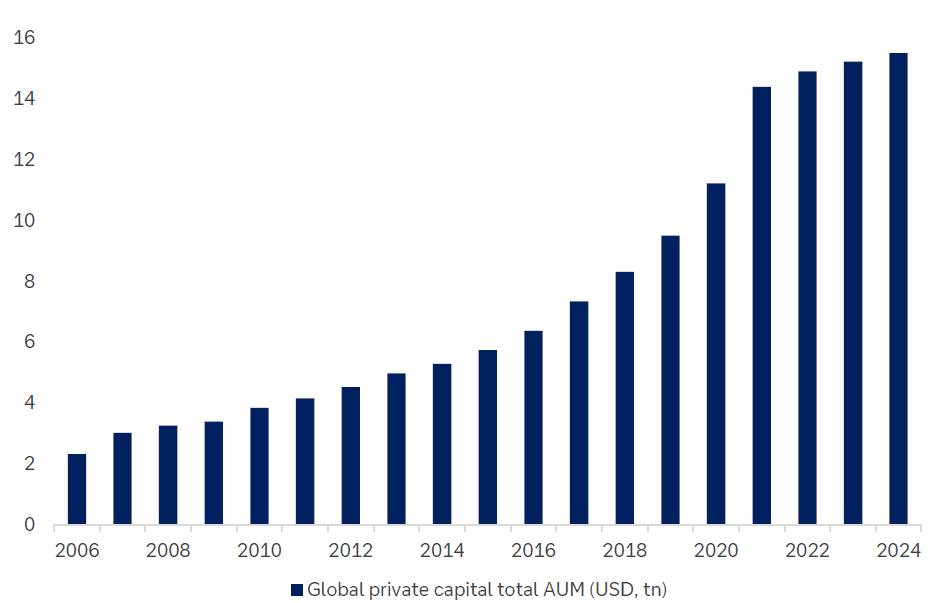
Chart 1: Growth of global private capital AUM, source: Deutsche Bank CIO “Alternatives and Strategic Asset Allocation”
Alternative Markets have also been home to some of the fastest growth areas over the last 5 years.
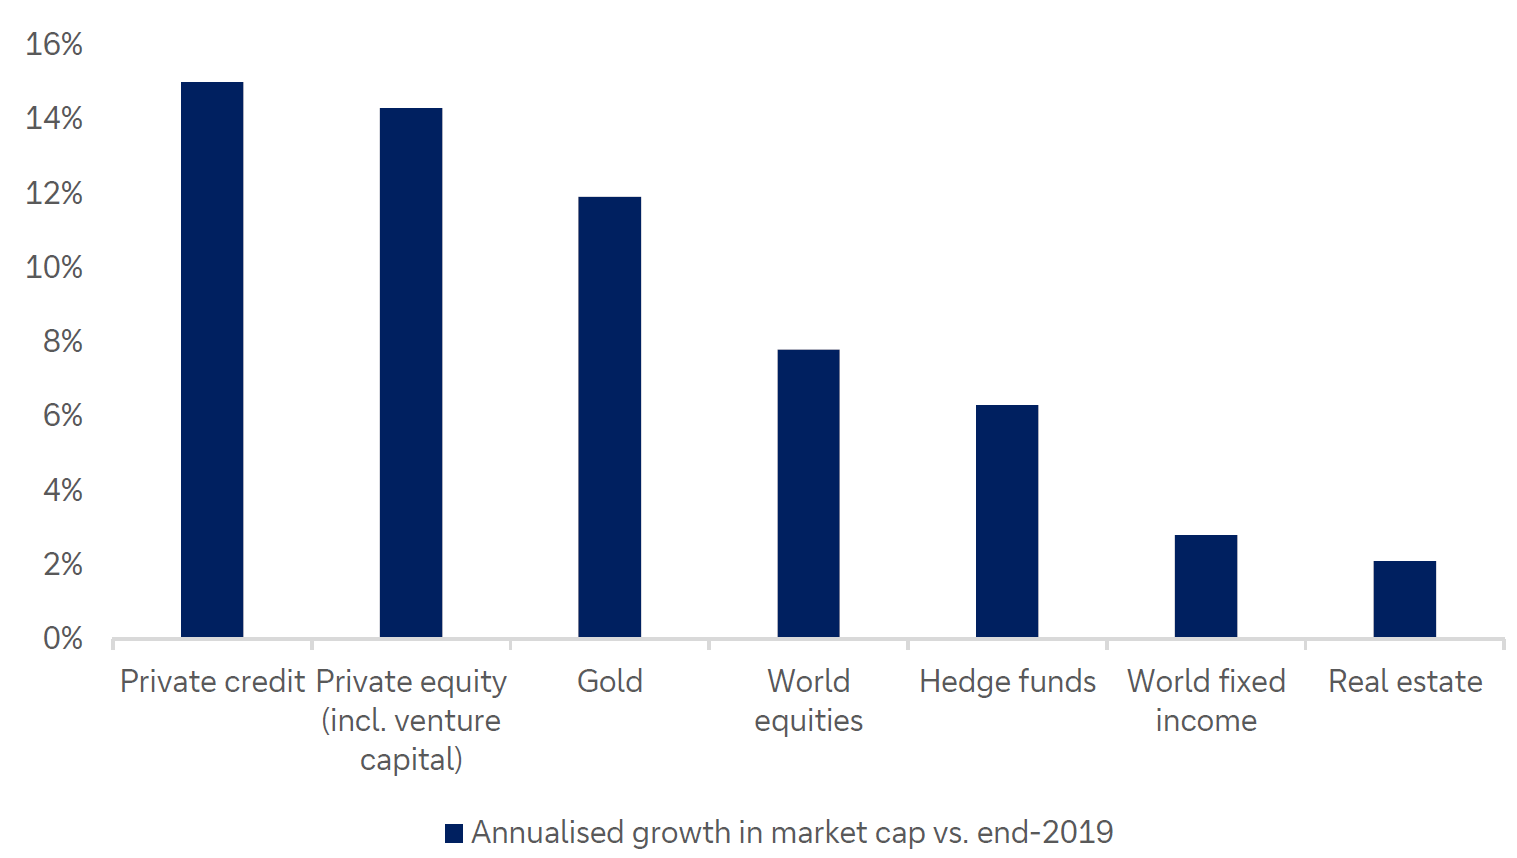
Chart 2: Growth rates of different asset classes, source: Deutsche Bank CIO “Alternatives and Strategic Asset Allocation”
The growth of private markets and alternatives in general is expected to be further driven by a broadening of the investor base by private wealth more and more joining already existing institutional investors to the party.
For a TPA allocator, the takeaway is simple: alternatives are no longer a niche bolt-on. They are a structural part of the investable universe, and ignoring them is an active bet now.
2. Defining the building blocks
Similarly to what we discussed in our blog post "Risk Mitigation with Hedge Funds", the building blocks can be thought of as:
-
Traditional: global equities, global IG bonds, global HY credit
-
Liquid alts:
-
Diversifying: equity market-neutral, multi-strategy, alternative risk premia
-
Risk-mitigating: trend-followers (managed futures)
-
Commodities
-
-
Illiquid alts: private equity, private credit, private real estate and/or infrastructure
These can also be seen and sorted accordingly to their main risk drivers, e.g.:
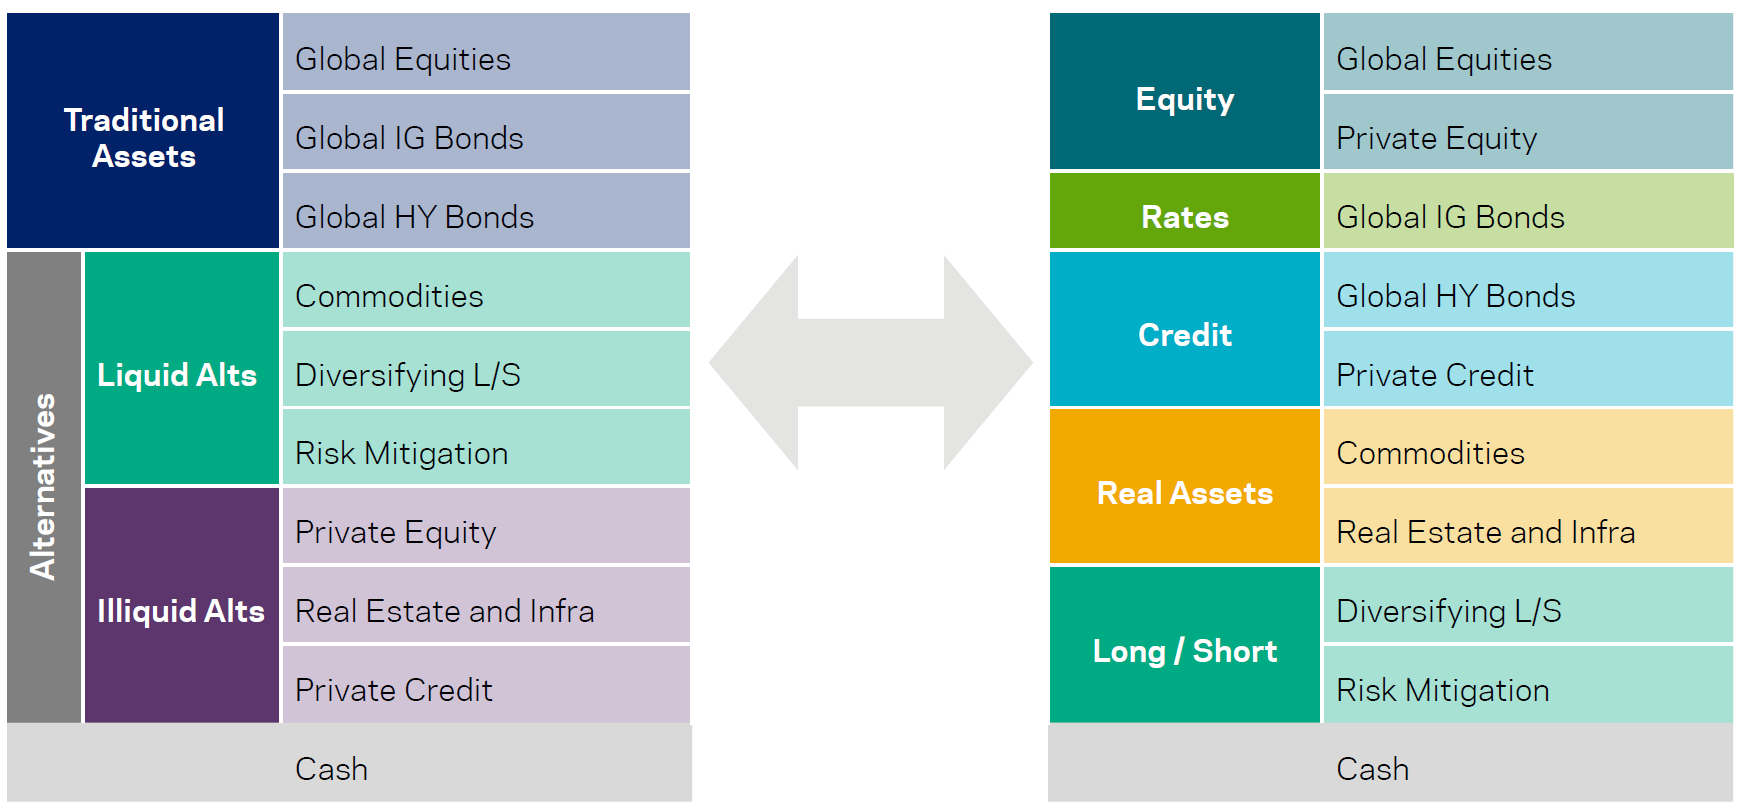
Chart 3: SAA building blocks and different ways of grouping them; source: AQR "Broad Strategic Asset Allocation..."
3. Expanding the Efficient Frontier
Starting with a traditional markets SAA and adding a genuinely diversifying alternative asset with similar Sharpe ratio but low correlation to traditional markets has a positive portfolio effect: the efficient frontier shifts outward; at a given volatility, you can earn higher returns, or for a given return, lower risk.
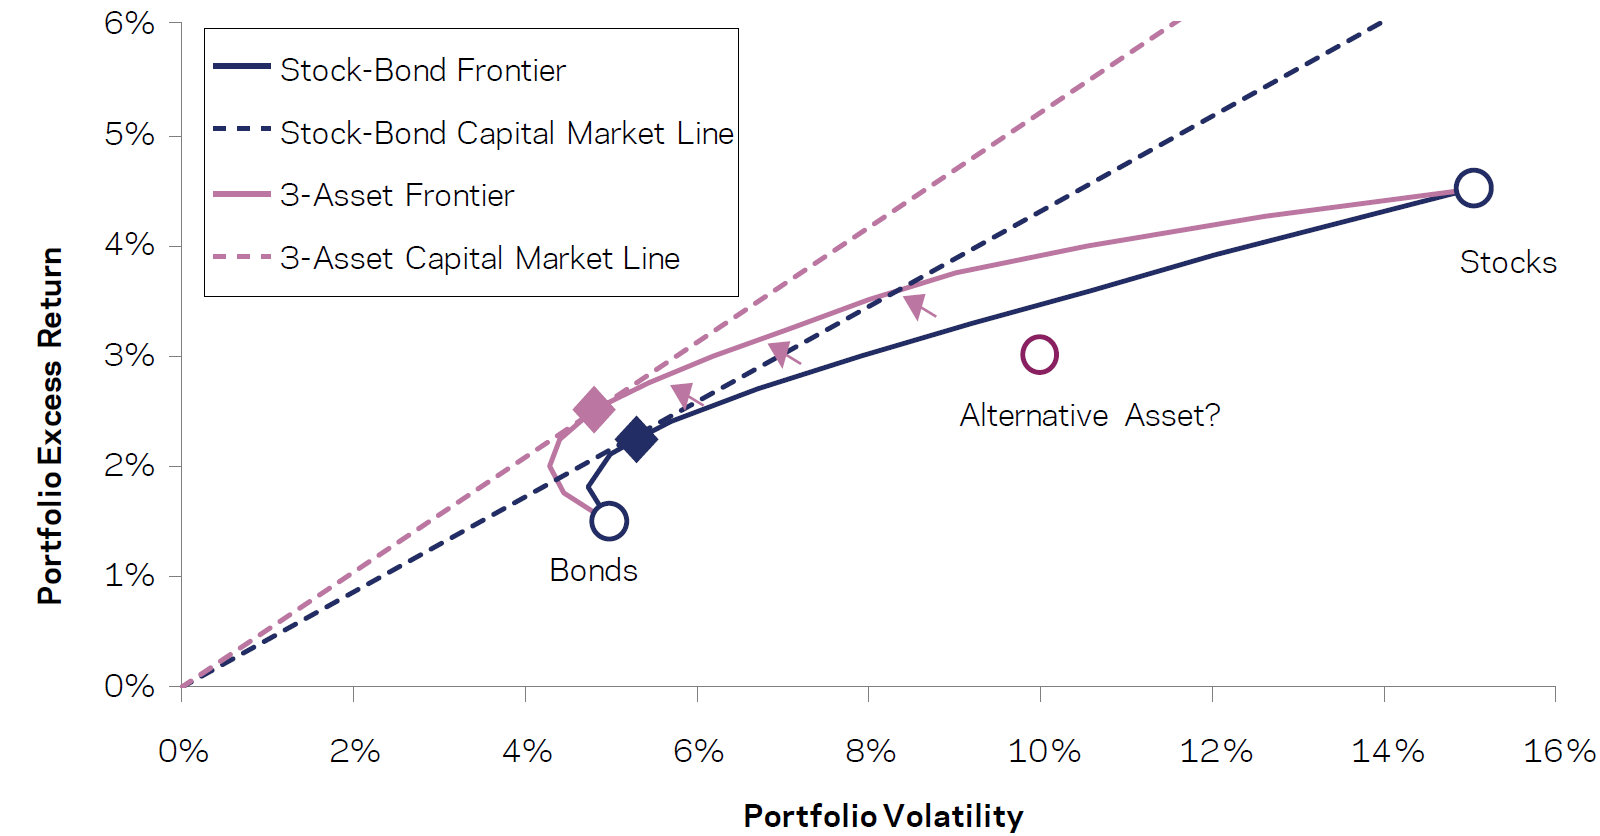
Chart 4: Adding an uncorrelated asset to a traditional portfolio; source: AQR "Broad Strategic Asset Allocation..."
4. The Wealth Management Lens
One can build an efficient and robust (meaning resilient to assumptions being wrong) SAA quantitative framework.
This means that risky or hard-to-estimate premia (e.g. some private assets) get a larger “confidence haircut” regarding long-term expected returns, volatilities and correlations than well-observed ones (e.g., developed-market government bonds). Then a robust optimization can include a penalty for concentrating in places where assumptions are very uncertain. The result is a portfolio that avoids strong bets on weak assumptions but still participates meaningfully in assets with attractive premia but doesn’t let them dominate. It is an optimization that explicitly trades off robustness vs. efficiency.
Like our factor-based approach described in “Strategic Asset Allocation: 6 Practical Frameworks for Better Decisions”, for private/illiquid asset sone can model only the market-risk piece quantitatively, using liquid proxies, while treating liquidity risk and other frictions qualitatively and setting suitability constraints for clients.
Such a robust optimizer would yield weights for alternative assets in the range of 8-24% within the SAA, depending on risk appetite:
-
For conservative profiles, alternatives around 8–10% of total capital;
-
For balanced profiles, around 12–18%;
-
For growth and max-growth profiles, up to roughly 23–24% of capital in alternatives.
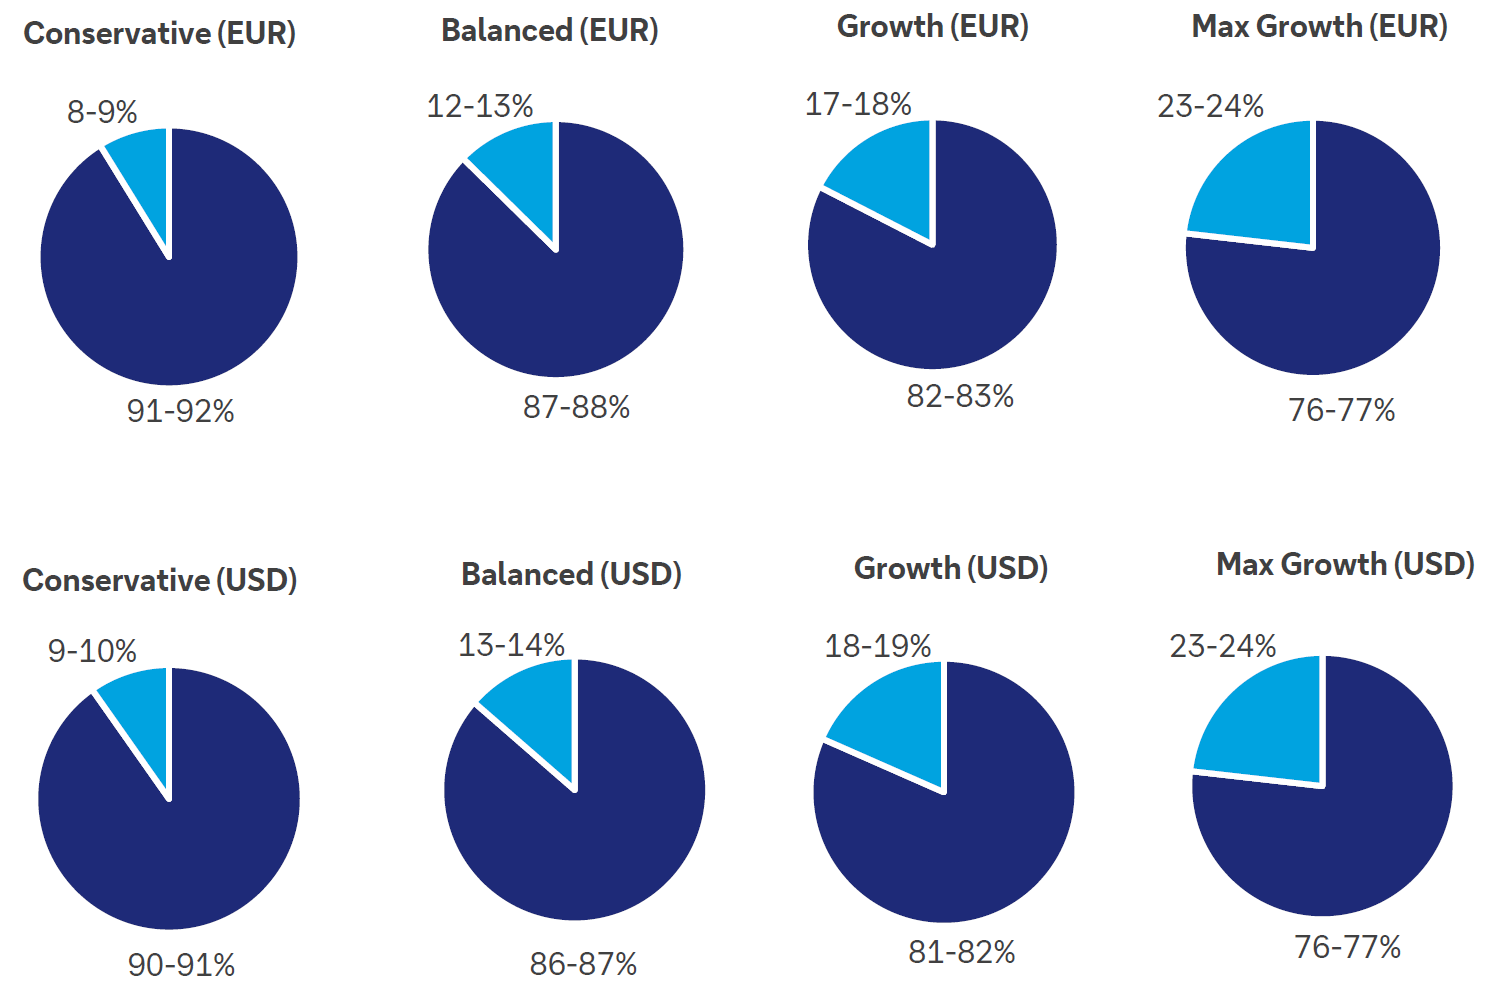
Chart 5: Alternatives share in strategic asset allocation by risk profile; source: DB CIO “Alternatives and Strategic Asset Allocation”
5. The Importance of Manager Selection within Alternatives
When making the SAA assumptions about alternative investment, one needs to acknowledge the importance manager selection plays.
In traditional equity and bond markets, the medium- to long-term performance spread between managers near the top and bottom of the rankings is often only around 1-2% per year. In alternatives, that gap blows out significantly: depending on the segment, the distance between top-quartile and bottom-quartile managers can stretch into double digits, in some cases approaching twenty percentage points annually. So, the outcome investors actually experience is overwhelmingly a function of manager selection and ongoing governance.
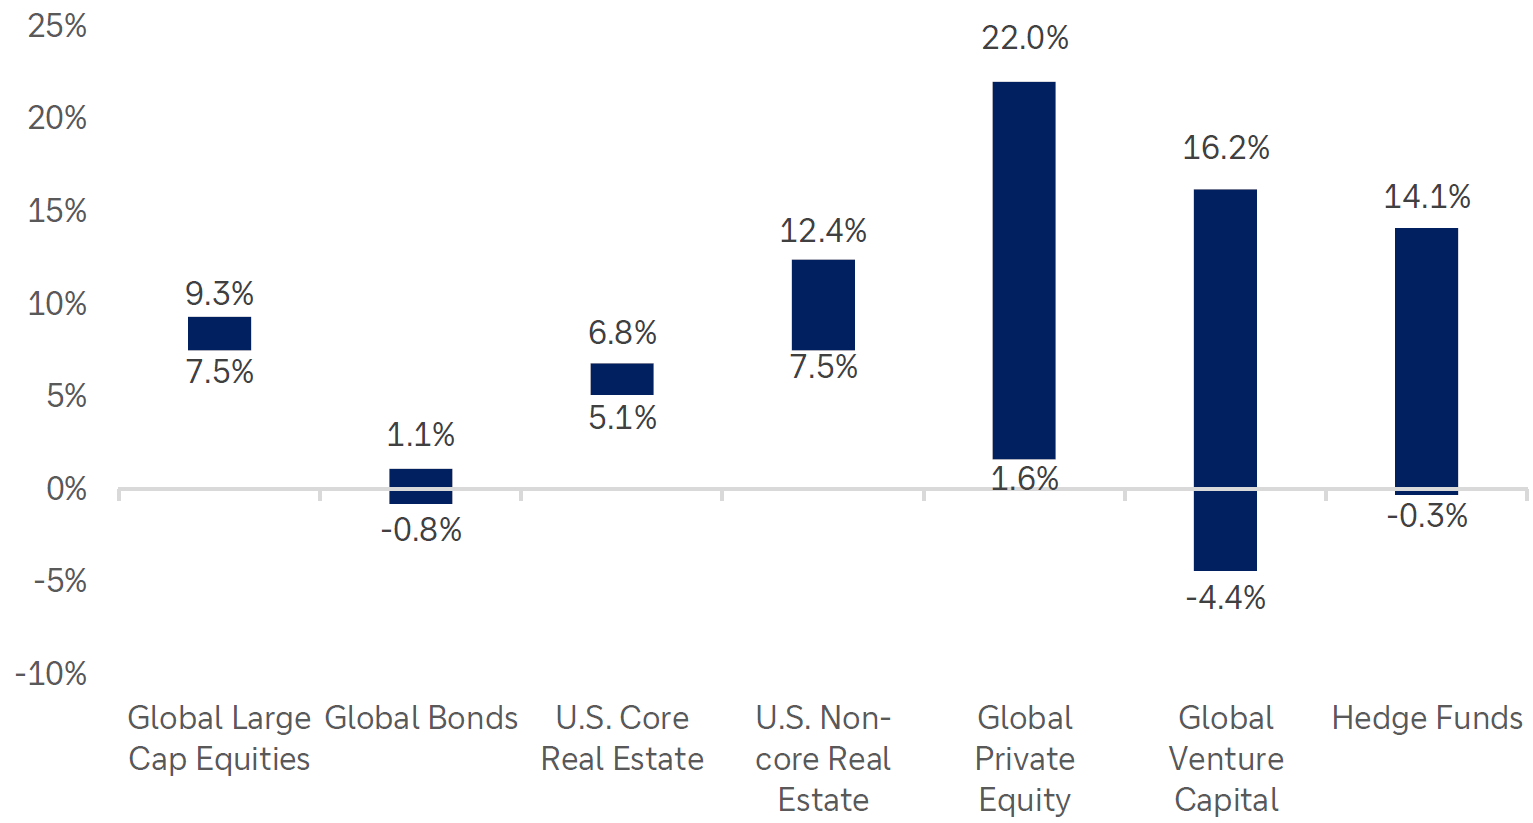
Chart 6: Alternatives dispersion is much wider than in traditional markets; source: DB CIO “Alternatives and Strategic Asset Allocation”
6. The Institutional Lens
If one assumes long-term Sharpe ratios of alternatives within the range of historical realized Sharpe ratios of traditional assets (meaning Sharpe ratios in the range of 0.24-0.36, while Sharpe ratios of 1.0-2.0 are achievable in alternatives with careful manager selection), one can come up with even higher SAA allocations to alternatives.
Part of these very conservative assumptions stems from the fact that private assets’ reported vol and correlations understate true economic risk because of smooth marks. Thus, one can use public-market proxies, estimates of typical leverage, and experience to back out more realistic full cycle volatilities and correlations for private equity, private credit, and private real estate. These are meant to reflect what shows up in prolonged stress periods, not just month-to-month noise.
Returns of all asset classes can be estimated by using an ensemble method of historical average returns, historical averages adjusted for past valuation changes, yield models where expected return is roughly equal to current yield plus expected long-run growth, and the latter can also be adjusted by expected valuation mean reversion.
Liquid alternatives are "punished" for self-selection/reporting/survivorship biases, and no manager selection skills are assumed. Illiquid alternatives are also assumed to deliver roughly the same net Sharpe (~0.3) as major public markets, i.e. any theoretical illiquidity premium is "eaten up" by higher fees and by investors’ preference for (optically) smoothed returns.
The ensemble of both yield-based inputs and long-term Sharpe ratio inputs allows for robustness to both today’s pricing conditions and long-run historical cycles.
Now one can run the optimizer vs. a 60/40 starting point under various additional constraints for e.g. tracking error (TE), complexity (proxied as TER / fees), leverage, illiquidity etc.
If one allows for more TE (2%, 4%) and higher fees, one would end up with a SAA weight of alternatives between 26% (2% TE) and 54% (4% TE), achieving higher returns for equla risk of a 60/40 portfolio. If one takes the 4% TE portfolio and decides to decrease its volatility, one would end up with an even higher alternatives allocation (57%). Both scenarios are shown below:

Chart 7: Relaxing TE and Fee restraints leads to a high Alternatives SAA weight, while reducing the volatility of a 60/40 portfolio on top increases the Alternatives weight even further - all under very conservative Share ratio assumptions; source: AQR "Broad Strategic Asset Allocation..."
Importantly, liquid alternatives are present at all scenarios / risk levels, because their low equity correlation and embedded leverage make them particularly efficient diversifiers. Allowing the SAA portfolio to use leverage, would lead to even higher levels of alternatives and in particular liquid alternatives, given strict assumptions regarding illiquid alternatives. The rough typical portfolio one obtains is as follows: 40% equities, 40% liquid alternatives, 10% traditional fixed income / credit, and 10% illiquid alternatives.
7. Factor Perspectives
Even if asset allocations look diversified, the underlying risk factors may not be as diversified, which is an important factor to consider as pointed out above.
Using only basic factor such as equity risk, interest rate risk, credit risk, inflation risk, one can show that a diversified looking portfolio can still be quite dominated by equity risk.
One can start with the weights of the building blocks and then volatility adjust those. Then factor betas of each building block can be applied and then aggregated.
Thus, a portfolio of 40% equities and 10% private equity (50% in total) turns out to be 65% exposed to equity risk, which then represents an even higher part of total portfolio variance. A technique we very keenly apply at Resonanz Capital.
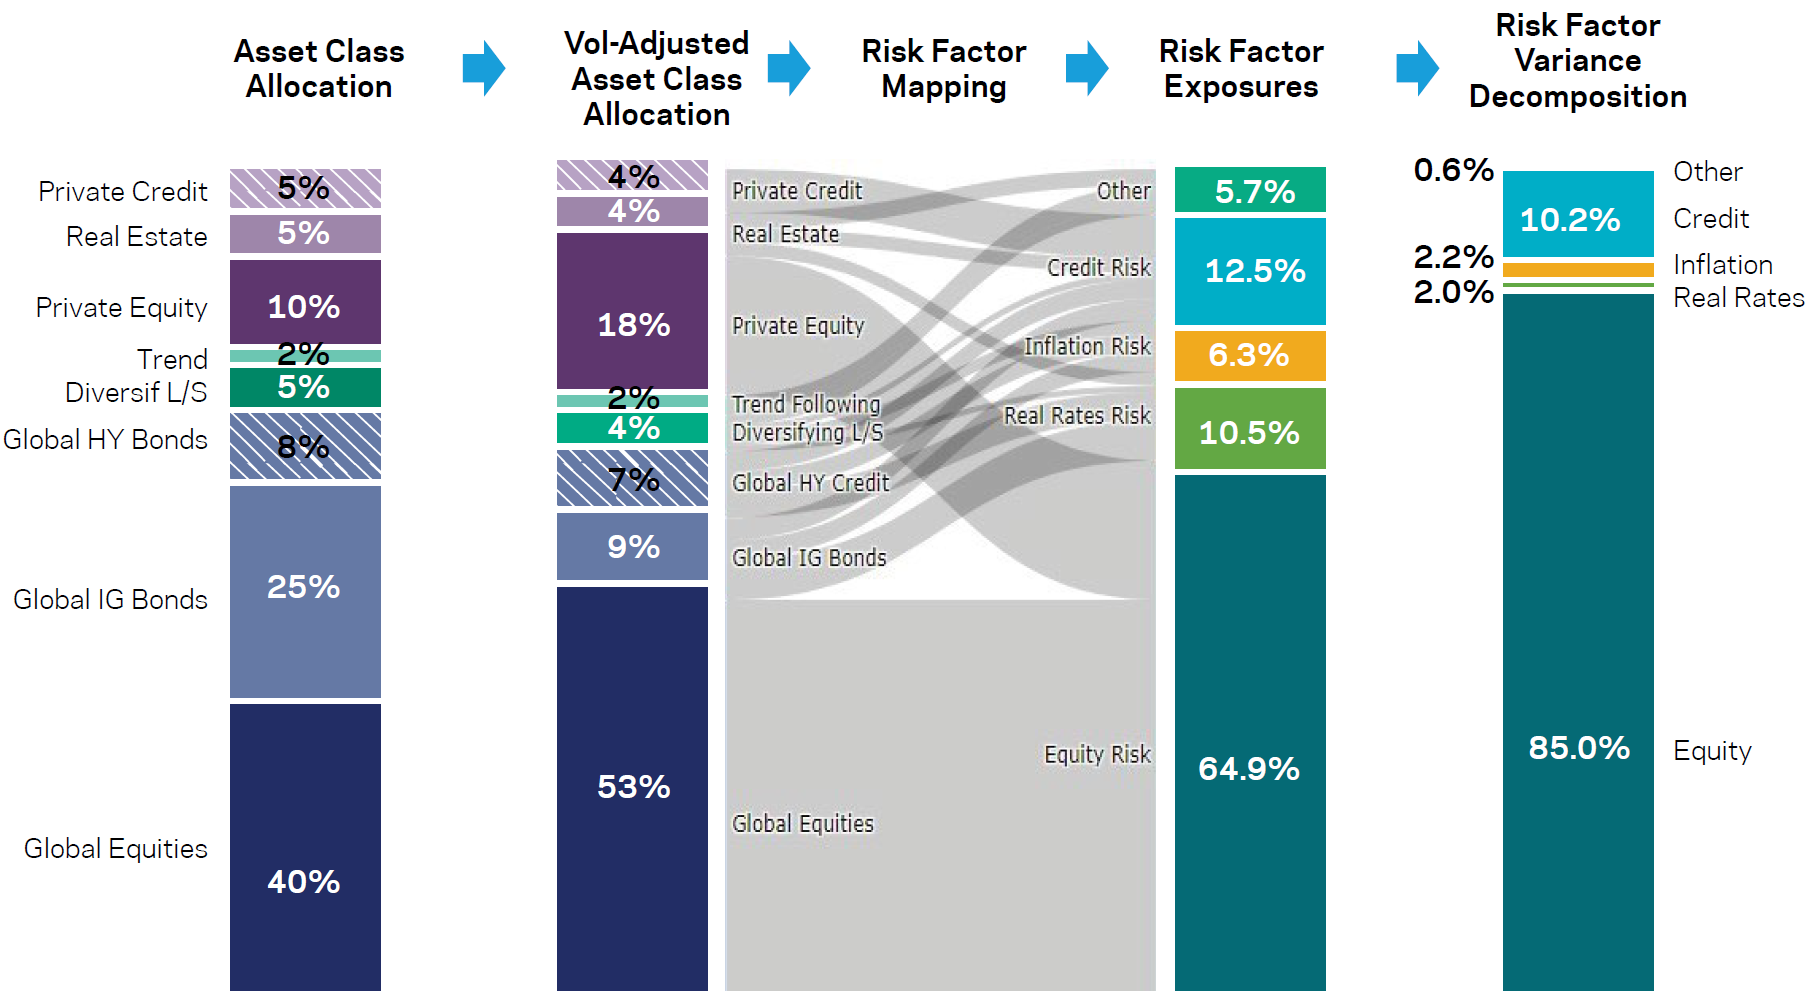
Chart 8: Decomposing a portfolio's factor exposures may lead to unexpected results with equity risk dominating; source: AQR "Broad Strategic Asset Allocation..."
Conclusion
Even if one assumes alternatives only as risk-factor and liquidity-profile extensions of the traditional universe, they tend to earn their place into the SAA. Quantitatively, once one assumes even very conservative Sharpe ratios and correlations, then applies realistic constraints, alternatives systematically earn their way into sophisticated portfolios.
Organizationally, the analysis is easiest to integrate in a TPA setting: you can treat building blocks as “liquid diversifiers”, "risk mitigators", "equity beta providers", "yield enhancers" etc. Importantly, a modern SAA / TPA investor who ignores alternatives is implicitly making very strong – and probably unrealistic – assumptions about factor premia, liquidity, and diversification.
For institutional or very patient capital (pensions, endowments, sovereigns, multi-family offices running with a TPA mindset) at a 60/40-type risk budget, a total alternatives band of roughly 30–55% of capital is defensible, with a large share in liquid diversifying strategies and a disciplined, budgeted share in illiquid private equity, real estate / infrastructure and private credit. For private-wealth contexts (with more binding liquidity, capacity and governance constraints), something like 10–25% in alternatives across the risk spectrum appears consistent robust SAA outputs.
The exact mix between hedge funds, liquid alt premia, private equity, real assets and private credit is then a second-order decision, conditioned on governance, sourcing and implementation edge.
Resonanz insights in your inbox...
Get the research behind strategies most professional allocators trust, but almost no-one explains.