
Hedge funds face crowdedness in limited factors. Monitoring factor exposure is crucial for performance and risk management.
12 min read | Mar 29, 2023
Financial research has established that the number of investable factors and assets is limited, and fund exposure to these factors can fluctuate over time. Hedge funds and mutual funds invest in various markets, such as equity, bond, commodity, or credit, among others. Importantly, Harvey and Liu (2016) found that there are numerous factors to consider, but only a few are both statistically and economically significant. In a previous post (Hedge Fund Returns and Alternative Risk Premium Factors – Resonanz Capital), we introduced risk factors and showed how they can be used to analyze hedge fund returns. We also showed how a broad universe of Bank Risk Premia, also known as QIS (Quantitative Investment Strategies) can be used to derive a set of alternative risk premia (Alternative Risk Premium Factors – Resonanz Capital). Measuring factor exposure is crucial for several reasons:
- The factor exposure of funds is time-varying and is driven by tactical asset allocation decisions and changes in market cycles.
- Factor premiums are time-varying and only relevant in the long run, as their short-term behavior differs from their long-term behavior.
- Systematic risk can change and become systemic, increasing the risk for a bulk of investments.
- Funds can experience style drift, which is often not detectable in advance.
- Factor investing has become popular, and investors and fund managers need to track factor performance for risk and portfolio management purposes.
This is the first part of a two-part post providing a non-technical introduction that extensively and empirically discusses crowdedness in factor investing. It is important to consider the effect of rising fund exposure to a specific factor and the consequence of low exposure to a factor, especially since factors have limited capacity. To capture this exposure, financial research has introduced the metric of crowdedness.
What is Crowdedness?
Following Scharfstein and Stein (1990), Pojarliev and Levich (2011), and Holland (2012), Cahan and Luo (2013), crowdedness refers to the decreasing payoff that occurs when a large number of portfolios are exposed to a particular strategy or beta factor. The concept of crowdedness can be seen as a source of either wisdom or stupidity and thus risk (see Surowiecki, 2005 and Buchanan, 2014). Measuring the factor or asset crowdedness helps determine the potential impact of the factor exposure of a group of funds on the performance of the respective factor, asset class, or variable. Crowdedness is a time-varying phenomenon that adjusts to factor performance and tends to decrease as fund managers’ market views on the specific factor diverge. Crowdedness can be a result of two types of management styles: factor models, which derive expected returns, and behavioral approaches that follow momentum tendencies in the market. Crowdedness exhibits trend-following properties, meaning that positive returns on a specific factor attract more funds to follow the strategy, and negative returns result in a decreasing exposure to that factor (see Nofsinger and Sias, 1999). Once the crowd tries to abandon the strategy, the liquidity spiral drags returns and increases volatility. The following two exhibits show what the crowdedness index looks like.
Exhibit 1: Cumulative Factor Crowdedness of the RC Factors in all four Peers: Feb 2010-Jan 2023.
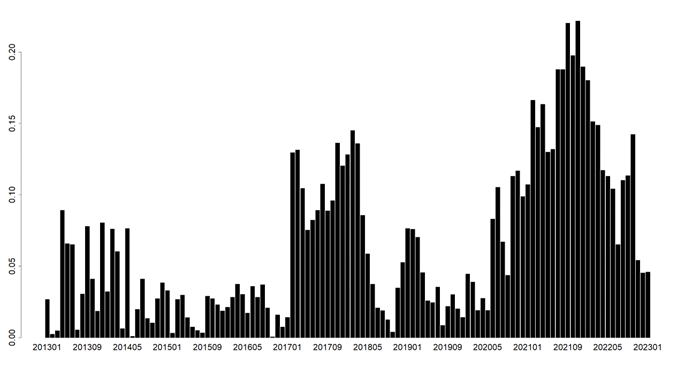
Exhibit 2: Cboe Volatility Index: Feb 2010-Jan 2023.
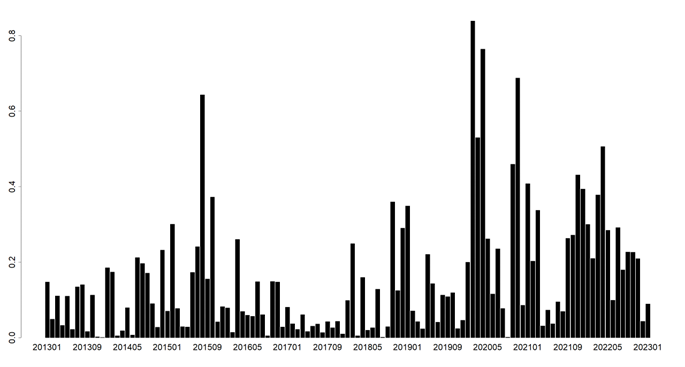
Source: Bloomberg, LLC.
The Cboe Volatility Index (VIX Index) is considered a risk indicator in financial markets, with higher risk being associated with higher market volatility. Comparing crowdedness to the VIX index shows that crowdedness increases with market volatility, but lower overall crowdedness is associated with lower market volatility. Therefore, crowdedness metrics are a good indicator of risk.
The present analysis helps investigate how the funds reflect on the changing returns of alternative risk premia or a factor. Alternative risk premia are the cornerstone of hedge fund strategies that help them generate alpha.
Hedge Fund Crowdedness
Hedge funds have been found to be exposed to a large number of investable factors, with well-known academic factors such as market, equity market liquidity, value, small size, and momentum accounting for the largest part of their exposure. However, these factors are also the most overcrowded in the market, as documented by Fung and Hsieh (2001, 2004), Blitz (2018), and Konstantinov and Rebmann (2020). The recently documented Betting-Against-Beta factor, which accounts for low volatility, is also an example of a crowded factor. The dynamic nature of the markets means that factor crowdedness can change rapidly, and the exposure of hedge funds to specific factors can become more volatile compared to long-only mutual funds. Therefore, effectively monitoring factor exposure of single hedge funds is important to identify possible trade-offs between market factors and possible idiosyncratic risks, as well as to identify possible style drifts. Additionally, the crowdedness analysis can gauge the exposure of closed and liquidated funds, providing an additional advantage.
Why Should Investors Monitor Crowdedness?
The RC factor set includes exposure to market beta factor (β), and exposure to alternative risk premia (ARP). The RC investment process and philosophy aim to capture ARP premia, which are returns that are not explained by traditional market factors such as beta or size, but rather by more unconventional risk factors. These factors may include style, sector, or country-specific risks, among others. By including ARP factors in their analysis, RC seeks to identify and capture sources of return that are not typically considered in traditional asset pricing models, and that may be less crowded compared to more well-known factors such as value or momentum. This approach can lead to more diversified portfolios that are less susceptible to crowdedness and herding behavior.
Detecting Crowdedness
Bayraktar Doole, Kassam, and Radchenko (2015) provided an overview of the two main approaches to measure crowded exposure in funds: return-based and holdings-based analysis. The return-based approach involves decomposing fund returns and evaluating their exposure to a set of factors, with the RC factor model commonly used to measure factor exposure in hedge funds.
 formula as pic missing
Where α is the independent source of return that cannot be gained by any common investment exposure and is an indication of skill, β is the exposure of a fund to market beta factor F, and γ is the fund’s exposure to sophisticated sources of return associated with investment strategies called Alternative Risk Premia ARP.
To compute the absolute crowdedness measure, the percentage of funds with significant positive exposure to a factor is subtracted from the percentage of funds with significant negative exposure to the same factor within a broad peer group or cluster of funds with similar investment philosophy. This approach is useful for monitoring the fund’s exposure to specific factors and is common for quantitative investors using factor investing. The crowdedness metric is an absolute level ranging between 0 and 1.
 formula as pic missing
Where F+ is the percentage of the funds with a significant positive exposure to the factors, and, and F- is the percentage of the funds with significant negative exposure to the factors. Thus, the crowdedness at time t to a factor is expressed as the absolute difference between the funds with positive less the funds with negative exposure to a factor. In general, the total factor crowdedness is measured over the entire set of factors and all funds and represents the cumulative factor exposure.
Often, the crowdedness can be measured relative to the overall factor exposure at a specific period of all funds. The intuition behind measuring crowdedness relative to the total factor exposure of the funds is to show the impact of specific factor crowdedness relative to the total factor crowdedness generated by a specific cluster of funds within a defined category, e.g., convergence, divergence, or liquid HF. The funds in the crowdedness estimate are treated equally, thus the fund size and strategy assets under management (AUM) are not criteria in the analysis. The magnitude of the exposure is also of no interest, as its significance is part of the metric. Having said that, a reasonable question emerges.
In finance, a positive crowdedness is typically interpreted as a sign of pro-cyclical behavior, as it indicates that a significant number of funds are following the same trend and investing in the same factor or set of factors. This can be beneficial during a period of positive factor performance but can also increase the risk of a large-scale sell-off if the factor experiences a sudden downturn (see Konstantinov, Fabozzi, and Simonian, 2023).
Conversely, a negative crowdedness is often viewed as a contrarian signal, indicating that a significant number of funds are taking a different approach than the prevailing market trend. This can be advantageous during a period of negative factor performance but may also result in missed opportunities if the factor continues to perform well.
Regarding the most appropriate method for measuring factor crowdedness, it depends on the goal. For a single fund, a factor model like LASSO or Ridge can be used to identify the specific factors that contribute to crowdedness. LASSO is often preferred for dimension reduction, while Ridge regression is used to combat overfitting and generalize on new data.
Time Step and Rolling Estimation Window
Empirical studies suggest that a rolling sample period of 24-36 monthly observations is appropriate when using monthly returns to estimate factor crowdedness. This period automatically excludes funds with a short track record while including defunct funds whose exposure may have contributed to factor crowdedness in the past. Shorter rolling periods can result in a larger number of funds being included in the analysis but can also increase the dispersion of returns and factor exposure. Previous research has found reliable results for factor crowdedness across various asset classes, including currencies, bonds, equities, and hedge funds.
After defining the number of funds in the sample, the crowdedness to a specific factor can be plotted as an index. Comparing this index to the performance of the corresponding factor provides insights into how crowdedness changes in response to the cumulative factor returns. It’s important to note that this does not necessarily imply causality. Additionally, the factor crowdedness measure shows how funds within a cluster change their exposure in response to factor performance.
Estimating the Cumulative Factor Crowdedness
The Ridge model is a statistical method that is used to estimate the crowdedness of a broad set of factors. It is used to identify which factors are contributing to the overall herding behavior of funds in a cluster. By comparing the cumulative positive factor exposure to the cumulative negative factor exposure, the model can identify whether the funds are herding in a particular direction. A positive crowdedness value implies that the majority of funds in the cluster have a positive exposure to the factors and ARP set, which may indicate herding behavior. Conversely, a negative crowdedness value suggests that the majority of funds have a negative exposure to the factors and ARP set, which may indicate that the funds are diverging in their investment strategies. By analyzing the cumulative crowdedness of a cluster of funds over time, investors can gain insights into the behavior of funds within the cluster and make more informed investment decisions (see Baltas, 2019).
In a forthcoming post related to crowdedness, we will provide detailed information about the crowdedness factor and statistical tests on its behavior to predict factor risk.
References
Baltas, N. 2019. “The Impact of Crowding in Alternative Risk Premia Investing.” Financial Analysts Journal 75 (3): 89-104.
Bayraktar, M., S. Doole, A. Kassam, and S. Radchenko. 2015. „Lost in the Crowd? Identifying and Measuring Crowded Strategies and Trades.” MSCI Research Insight
Blitz, D. 2018. “Are Hedge Funds on the Other Side of the Low-Volatility Trade?” Journal of Alternative Investments 21 (1): 17-26.
Buchanan, M. Forecast. Bloomsbery, 2014.
Cahan, R., and Y. Luo. 2013. “Standing Out from the Crowd: Measuring Crowding in Quantitative Strategies.” Journal of Portfolio Management 39 (4): 14-23.
Fung, W., and D. Hsieh. 2001. “The Risk in Hedge Fund Strategies: Theory and Evidence from Trend Followers.” Review of Financial Studies 14 (2): 313-341.
Fung, W., and D. Hsieh. 2004. “Hedge Fund Benchmarks: A Risk-Based Approach.” Financial Analysts Journal 60 (5): 65-80.
Harvey, C. R., and Y. Liu. 2016. “and the Cross-Section of Expected Returns.” Review of Financial Studies 29 (1): 5-68.
Holland, J. Signals and Boundaries: Building Blocks for Complex Adaptive Systems. MIT Press, 2012.
Konstantinov, G. 2017. “Currency Crowdedness Generated by Global Bond Funds.” Journal of Portfolio Management 43 (2): 123-135.
Konstantinov, G., and J. Rebmann. 2020. “Different In Nature, Common in Style: View Commonality of Single Hedge Funds and Funds of Hedge Funds.” Journal of Alternative Investments 23 (2): 49-66.
Konstantinov, G., F. J. Fabozzi, and J. Simonian. Quantitative Global Bond Portfolio Management, World Scientific Press, 2023.
Leibowitz, M. 2005. “Alpha Hunters and Beta Grazers.” Financial Analysts Journal 61 (5): 32-39.
Nofsinger, J., and R. Sias. 1999. “Herding and Feedback Trading by Institutional and Individual Investors.” Journal of Finance 54 (6): 2263-2295.
Pojarliev, M., and R. Levich. 2011. “Detecting Crowded Trades in Currency Funds.” Financial Analysts Journal 67 (1): 26-39.
Scharfstein, D., and J. Stein. 1990. “Herd Behavior and Investment.” American Economic Review 80 (3): 465-479.
Simonian, J., and C. Wu. 2019. “Factors in Time: Fine-Tuning Hedge Fund Replication.” Journal of Portfolio Management 45 (3): 159-164.
Resonanz insights in your inbox...
Get the research behind strategies most professional allocators trust, but almost no-one explains.