Decoding Manager Success: Analyzing Equity Long/Short Returns and the Key Factors that Drive Performance. Learn how to dissect returns, identify persistence, and evaluate manager skill beyond stock picking.
8 min read | Nov 7, 2023
In the vast landscape of hedge fund products within the equity long/short arena, investors face a formidable task. The pursuit is to sieve through this diverse array in search of a select few managers who not only survive scrutiny but exhibit a discernible edge justifying their existence. The process of selecting managers, irrespective of an investor's criteria, hinges on extrapolating managerial skill from available historical data.
Empirical examination is commonly approached via two key methodologies: a time-series analysis that contextualises an individual manager's recent returns within a historical framework, and a cross-sectional analysis that benchmarks an individual manager's returns against similar peers. Yet, both approaches entail analytical pitfalls that might lead investors astray. Many of these pitfalls are well-documented, including Patari and Tolanen (2009) who explored the tendency of investors to rank managers by quartiles based on their Sharpe ratios, which has limitations when used alone to assess hedge fund performance. They concluded "hedge funds frequently generate non-normal return distributions, and therefore the applicability of the Sharpe ratio to the evaluation of hedge funds particularly as the sole or the primary performance metric is questioned in many previous studies".
The broader challenge facing investors extends beyond merely unearthing evidence of managerial skill. It necessitates the identification of return persistence to diminish the likelihood that skill has been identified through statistical coincidence. Employing a multi-period framework using ample data is one way to discern between persistence attributed to chance and that accredited to managerial skill. However, past studies have noted that despite the various statistical tests used, the persistence of hedge fund performance tends to be a short-term phenomenon.
This blog post does not seek to reiterate past studies proposing optimal techniques for navigating the challenges posed by short track records, skewed return distributions, and numerous other hurdles muddling the identification of managerial skill. Rather, its purpose lies in fragmenting these complex tasks into manageable components. Implicit in this approach is that investors are willing to collect and interpret managers' return data and make accurate inferences from it. Herein lie supplementary techniques aiming to equip investors with the tools necessary to pose more informed inquiries. Let's explore these techniques.
Decomposing returns
Our first task is to disaggregate returns originating from a manager's long book. We're looking at returns originating from the long book for two reasons. First is due to the significant long bias that engenders equity long/short portfolios. Indeed the managers we examine below averaged 55% net exposure over recent years. Second is to reduce the extent to which technical considerations (eg: short borrow) could obfuscate the link between the manager's decision making and its measurable portfolio impact. In order to decompose long returns into intuitive parts, let's consider its constituents:
Composition + Trading = Returns
Since composition can be further disaggregated into stock picking and concentration, we can expand the above equation into the following:
( Stock-picking and Sizing ) + Trading = Returns
Disaggregating it this way makes the important distinction between stock picking and sizing. The former is attributable to the stock contents of the long book, in effect a direct result of the manager's stock selection. The latter is attributable to adjustments in position sizes, in effect a result of the manager's conviction, liquidity and portfolio construction decisions. We found the latter to be a disproportionate driver of returns in the equity long/short space and hence warrants close scrutiny from investors. Let's see how investors could benefit from decomposing returns in this way, and whether it could help distinguish manager skill from luck. Fortunately, investors have a few ways to measure each of the constituents in the above equation:
- Stock picking can be measured with the "hit ratio" for example. This ratio captures the portion of winning versus losing positions. The higher the better.
- Sizing can be measured with the "win/loss ratio" for example. This ratio captures the profits from the average winner divided by the losses (inversed) from the average loser. The higher the better.
- Trading skill can be measured a variety of ways, including value-added implied by position adjustments, after omitting organic stock performance. Again, the higher the better.
Stock Picking vs. Sizing
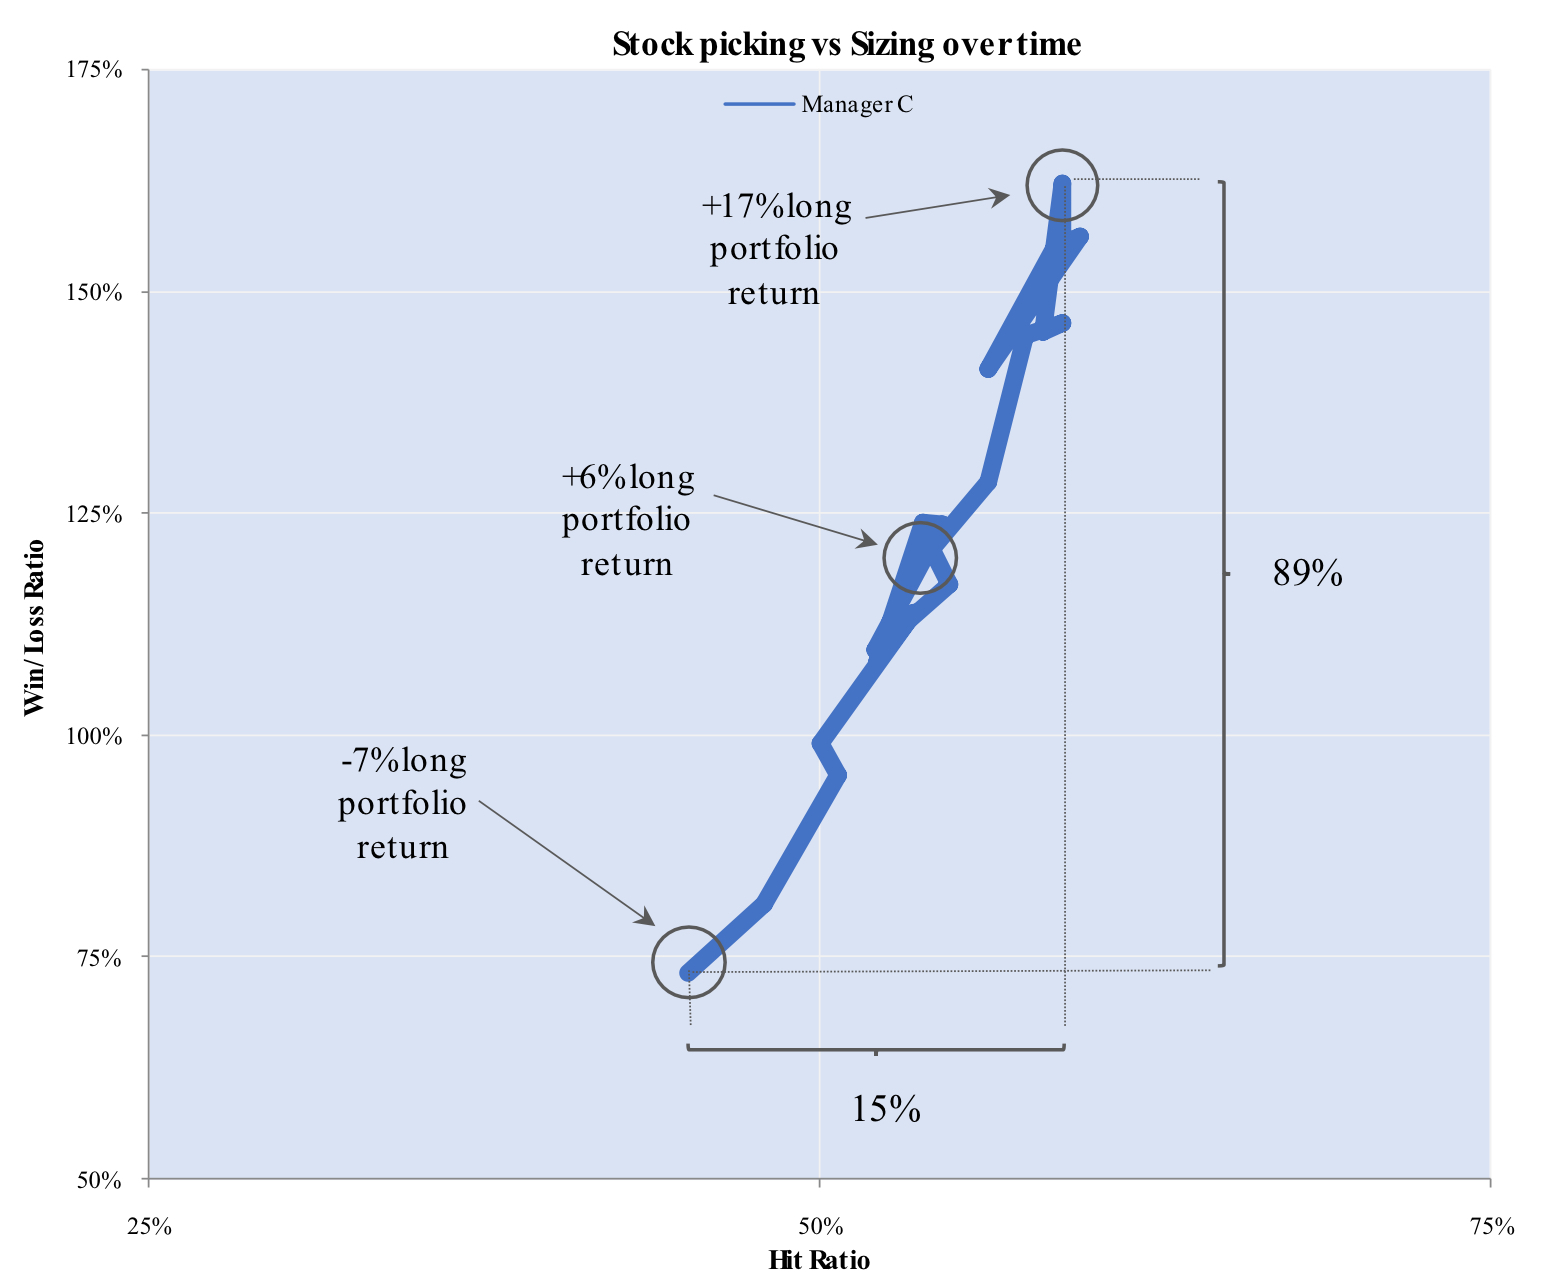
We can visualize the first two metrics on a single chart in an intuitive way. To avoid arbitrarily choosing a date range (and subjecting our analysis to biases) let's chart attribution data over all rolling twelve-month periods over a multi-year time range. It has the added benefit of visualizing how these two variables interact with each other over time. A few things stand out from the chart below, but key among them is how much more variable the win/loss ratio is relative to the hit ratio, when viewed over time. In this particular manager's case almost 6x. This is a common feature in the equity long/short space. While the ability to pick stocks is important, very few managers are able to sustain meaningfully higher than 50% hit ratios over the long run. In our experience, the ability to size winners larger than losers has deeper implications for results, as shown in the long portfolio return figures below. In this way, managers can more effectively differentiate themselves from peers.

Note: based on long attribution data originating from a single equity long/short manager. Figures are net of transaction cost but gross of fees representing averages over all rolling 12m intervals since January 2020.
When we replicate this methodology across a number of managers in the equity long/short space, we came to similar conclusions.
The below diagram shows corresponding data for three distinct equity long/short managers during an overlapping time period. Empirical data seems to suggest the positive relationship we saw above is a pervasive feature. In other words elevated hit ratios tend to coincide with elevated win/loss ratios.
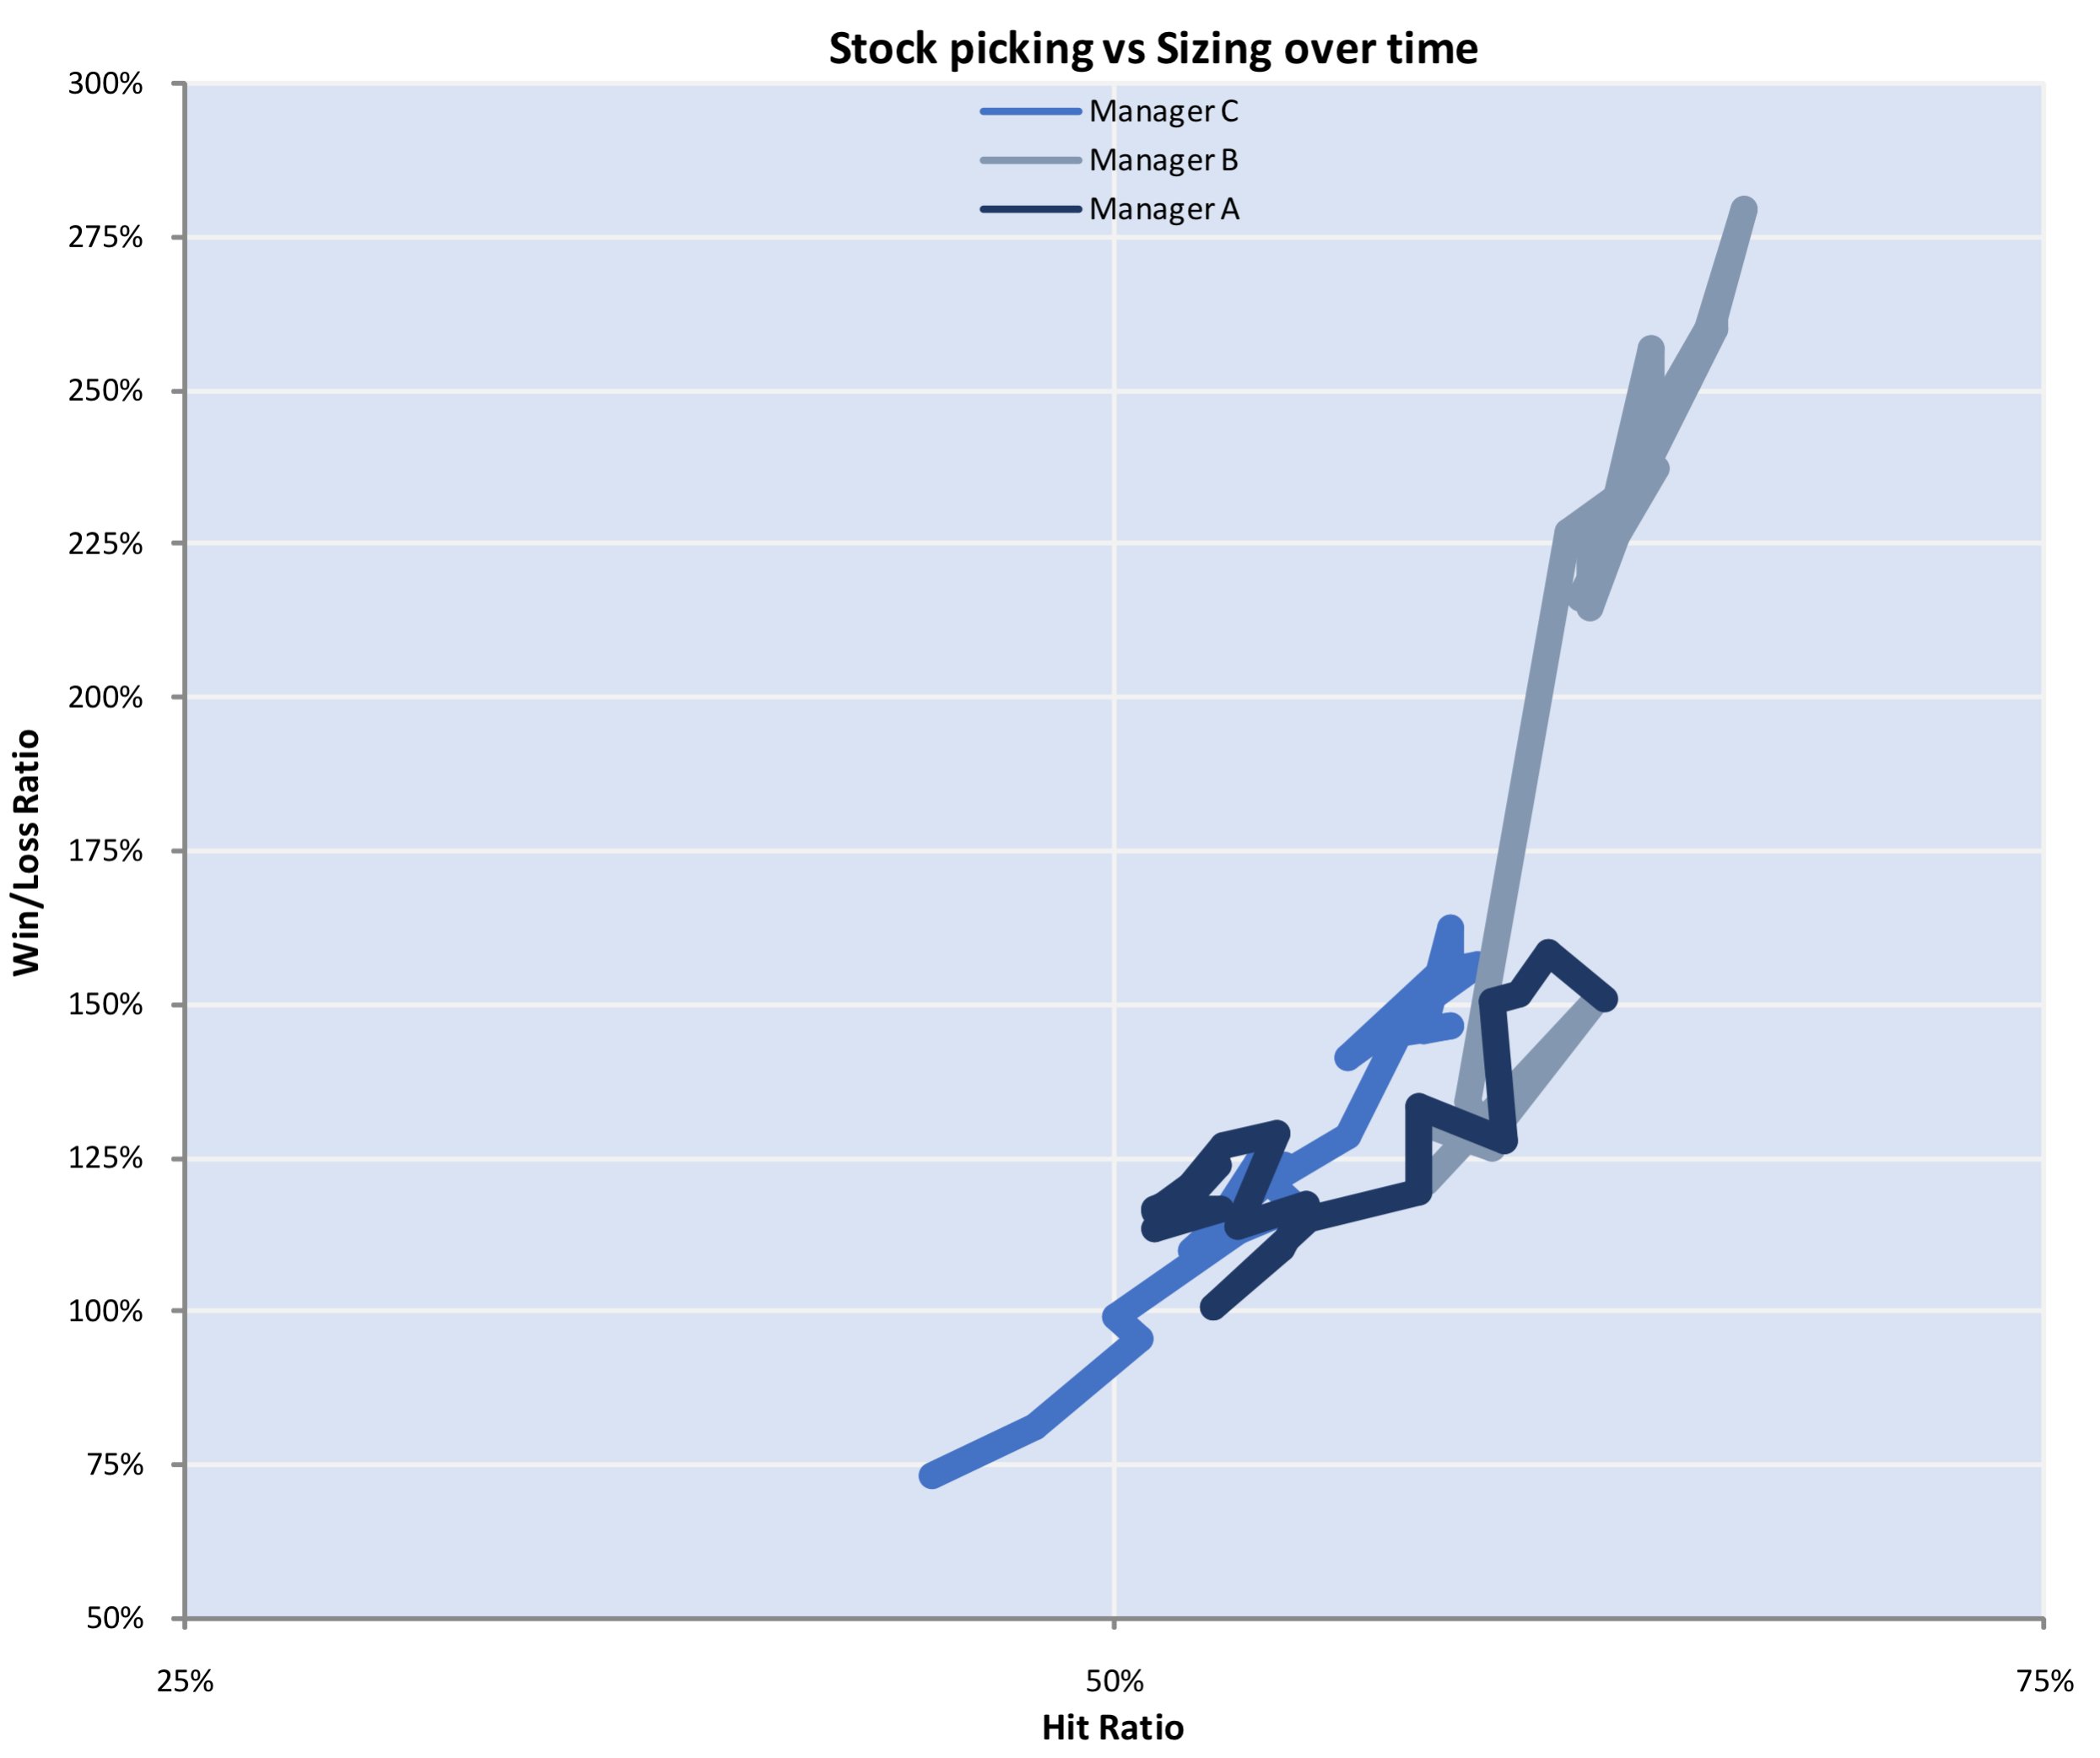
Note: based on long attribution data originating from three distinct equity long/short managers. Figures are net of transaction cost but gross of fees representing averages over all rolling 12m intervals since January 2020.
While this tool can help investors perform manager comparisons (or indeed perform a time series analysis of a single manager), it is not evidence of manager skill by itself. It is nevertheless important for investors to tailor their analysis based on the relevant return source.
Trading Adjustments
For investors seeking to make objective judgments on return persistence, we need to take a closer looks at a manager's trading activity. Specifically the impact their position adjustments have on returns. This technique subtracts model returns (assuming the manager did not adjust the number of shares it owned) from actual returns in any given time period. Effectively this omits the organic performance of stock holdings, and uses the residual to infer the manager's trading acumen. The residual is a positive if the manager's position adjustments were value-additive to portfolio returns, and negative if the manager's position adjustments were value-negative to portfolio returns.
By observing how these residuals change over time, investors can observe the manager's incremental value-add, as shown in the chart below.
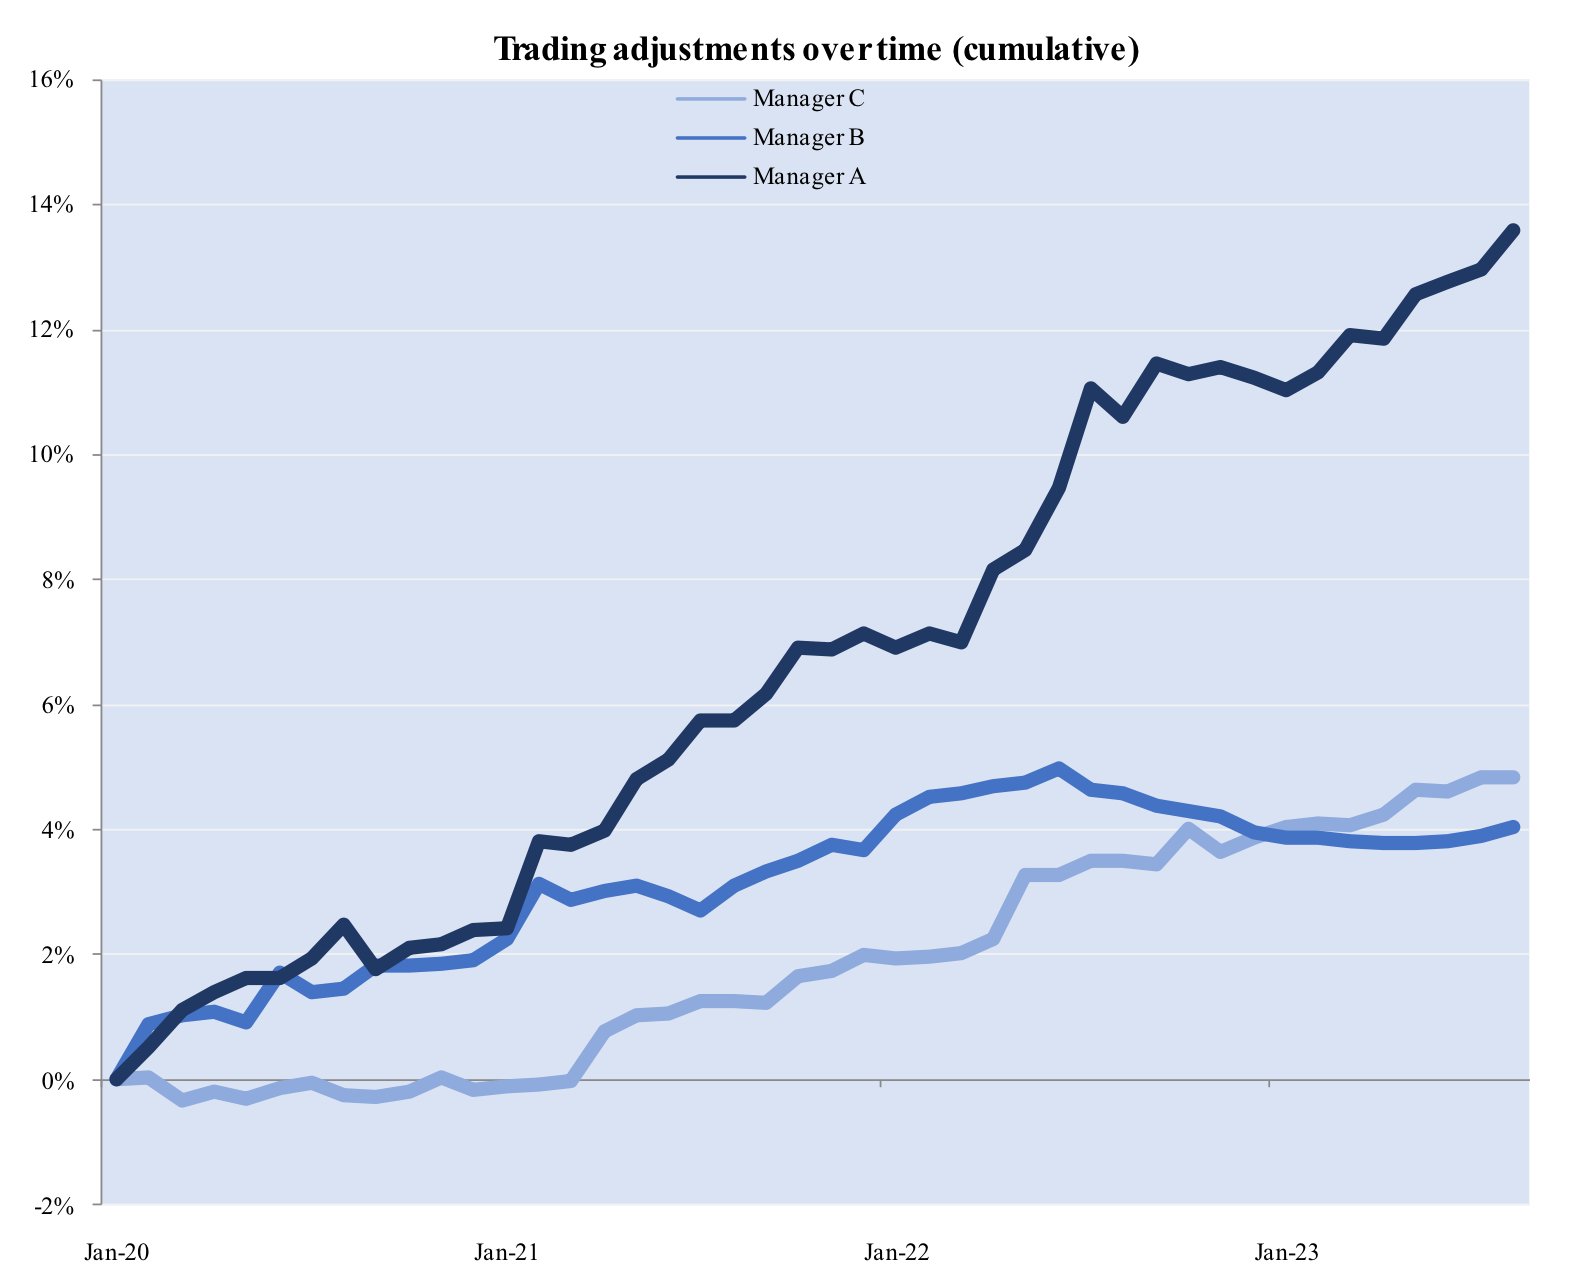
Note: based on long attribution data originating from three distinct equity long/short managers. Figures are net of transaction cost but gross of fees.
Lastly, let's consider what empirical data is telling us holistically, taking into account the aforementioned findings. Using the table below to assemble our findings, we see that Manager A was able to add +4.3% in annual returns by trading adjustments on top of the organic performance of its holdings. A stellar result, especially considering Manager A's hit and win/loss ratio were almost identical to those of Manager C. In a similar vein, Manager C has been able to generate almost the same long returns to those of Manager B with much lower hit and win/loss ratios, thanks to its trading adjustments.
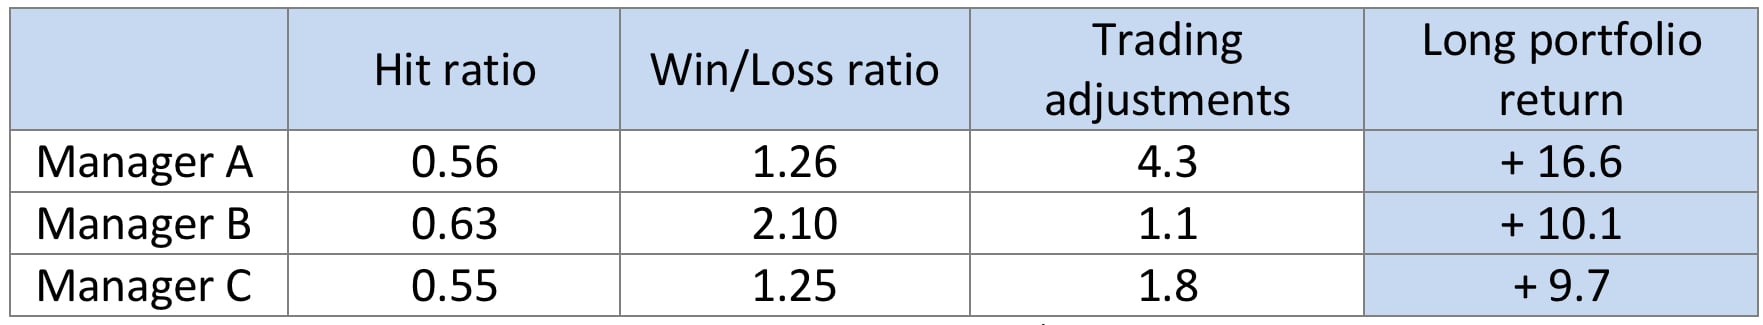
Note: based on long attribution data originating from three distinct equity long/short managers. Figures are net of transaction cost but gross of fees. Figures represent averages over all rolling 12m intervals since January 2020.
Conclusion
In evaluating managers, investors can augment traditional risk-adjusted metrics with nuanced components shaping a manager's success. This combined approach may offer a more comprehensive understanding of past performance and its implications for the future. Our proposed techniques offer a window into dissecting returns, identifying persistence, and discerning manager skill beyond mere stock-picking prowess. These methods disentangle the multifaceted nature of equity long/short returns, providing insights into the impact of managerial decision-making. Observing that a manager's ability to generate incremental return extends beyond stock selection to factors like sizing and trading adjustments, it becomes evident that a holistic evaluation is crucial for a comprehensive understanding of a manager's performance.
Resonanz insights in your inbox...
Get the research behind strategies most professional allocators trust, but almost no-one explains.