
Bank risk premia are used to construct alternative risk factors across asset classes, capturing strategies like carry, momentum, liquidity and more.
8 min read | Apr 18, 2022
In a previous post (Identifying Alternative Risk Premium Factors), we outlined how bank risk prima can be used to construct common alternative risk factors that contain largely orthogonal information. These risk factors are based on complex investment strategies across asset classes and may mimic some of the investment strategies of hedge funds. In this post, we highlight the type of information conveyed by the various alternative risk premium factors.
Overview Of Alternative Risk Premium Factors
By collecting almost 1000 different alternative bank risk premia, we are able to construct alternative risk factors for 13 different premia categories for up to 6 different asset classes. The detailed explanation of this approach can be found in our previous post (Identifying Alternative Risk Premium Factors). In addition to these alternative risk premia, we construct 12 factors that we call “Beta”. These factors are composed of market indices for different asset classes and regions and reflect general market risk factors. The following table shows the average annualised returns, the cross-sectional dispersion between annualised returns and the average market betas for each premium group:
| Factor Group | Number of Factors | Mean Ret | Cross-Sectional StD | Mean Equity Beta |
|---|---|---|---|---|
| Alpha | 2 | 3.03% | 1.06% | 0.10 |
| Carry | 6 | 8.42% | 3.17% | 0.13 |
| Event | 1 | 5.69% | nan | 0.23 |
| Liquidity | 5 | 8.18% | 5.29% | 0.02 |
| Low Volatility | 6 | 3.19% | 6.39% | -0.14 |
| Mean Reversion | 2 | 6.52% | 2.73% | 0.17 |
| Momentum | 6 | 5.96% | 1.29% | -0.02 |
| Multi Premia | 4 | 8.15% | 1.79% | 0.01 |
| Size | 1 | -1.14% | nan | 0.12 |
| Seasonality | 2 | 8.79% | 1.33% | -0.02 |
| Value | 4 | 4.62% | 0.82% | -0.05 |
| Volatility | 6 | 5.93% | 3.83% | 0.12 |
| Quality | 1 | 6.20% | nan | 0.06 |
| Beta | 12 | 4.16% | 2.07% | 0.18 |
Table1: Summary Statistics of Risk Factors by Group
The first column of the table above shows the number of different alternative risk premium factors per group. Some groups (Event – equities only, Size – equities only and Quality – equities only) include only one asset class, while most include at least four different asset classes. Since we classify different market risk factors (for different asset classes and regions) as “Beta”, the Beta group as a whole is the largest. Overall, we can see that most alternative risk premium factors as a group provide positive annualised returns on average (the only exception is the Size group, which consists only of the RC Equity Size factor). Alternative seasonality risk premium factors (8.8%) and alternative carry risk premium factors (8.4%) deliver the highest returns on average. Alternative low volatility risk premium factors (6.4%) and alternative liquidity risk premium factors (5.3%) have the highest standard deviation among the annualised returns of their components. Finally, the average equity beta tends to be low, with the highest value for the event group (0.23) and the lowest for the low volatility group (-0.14). This result is intuitively understandable, as the alternative risk premium factors aim to capture investment strategies that are not spanned by market factors. Note that the beta group has an average equity beta of only 0.18, even though it captures market risks. This is due to the diversity of different asset classes and markets included under “Beta”, some of which have a negative correlation to equity markets. Within this group, the equity betas range from 1 to -0.31.
(click on the chart below to increase the size)
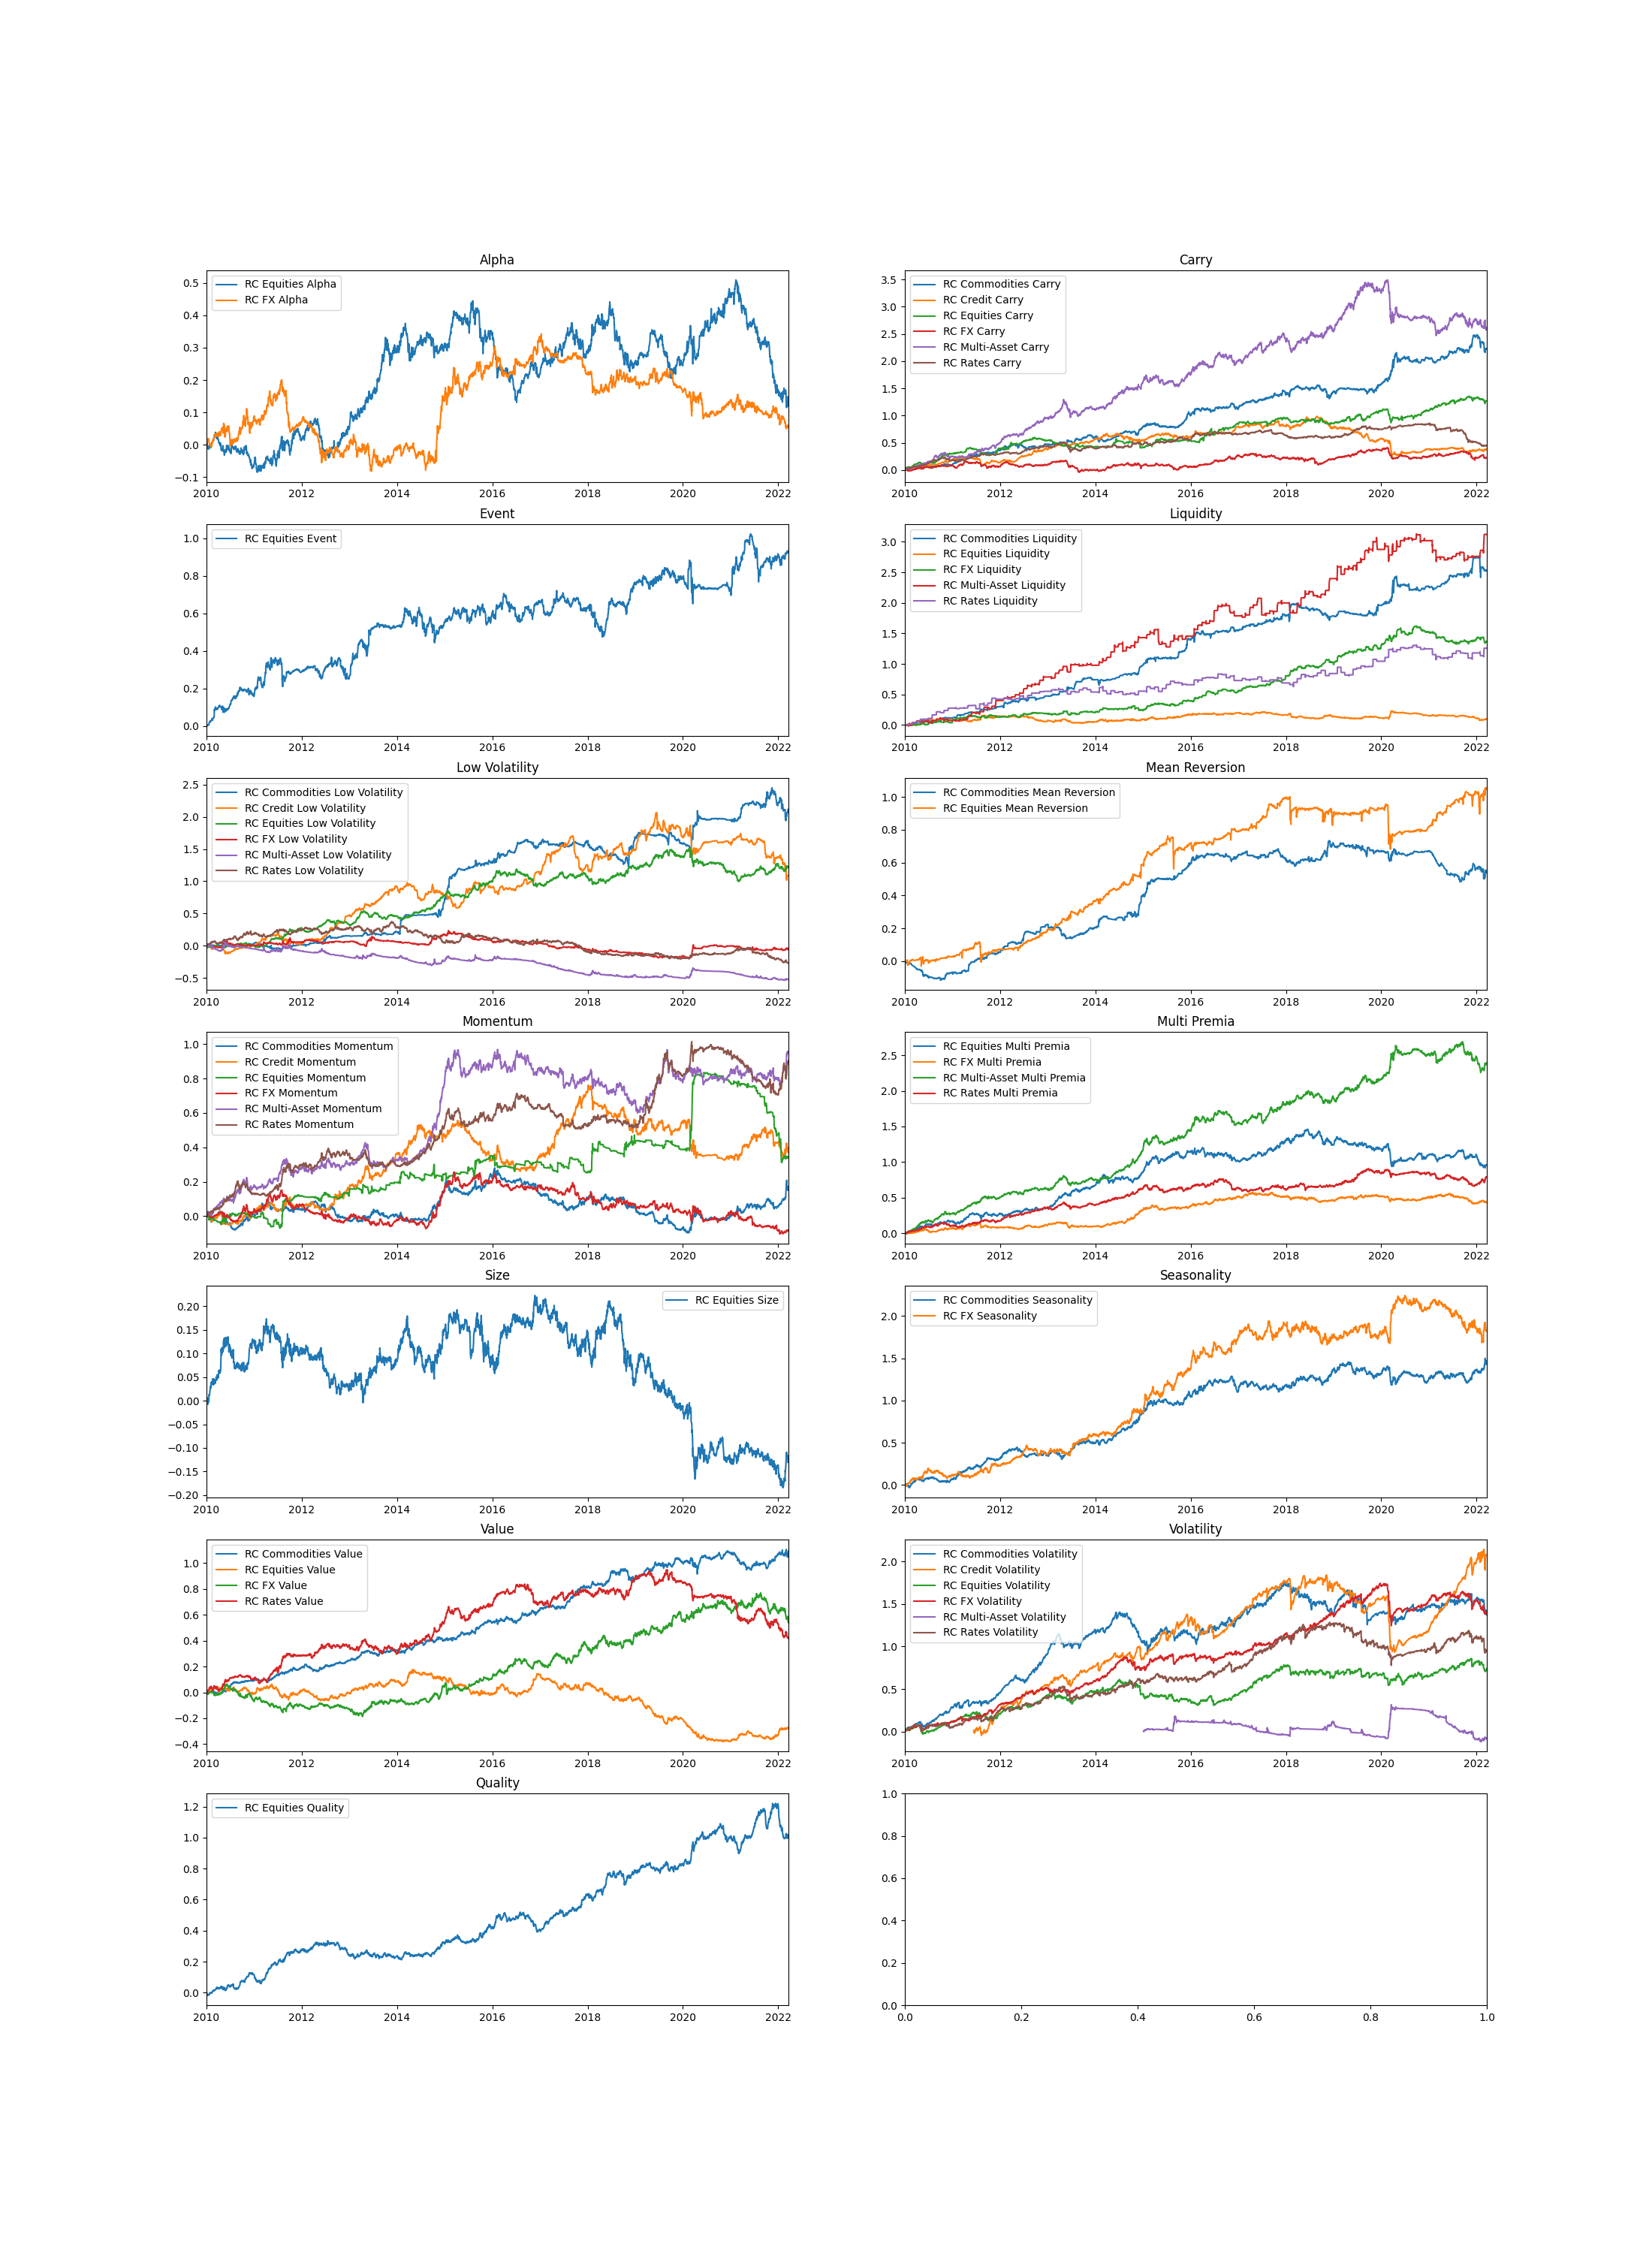
Figure 1: Cumulative Returns of Risk Factors by Group
Alpha
The two alternative alpha factors focus on alpha capture and use 13F position reports (equities) and derivative position sentiment (FX) to extract the wisdom of market participants. Both alpha factors have a relatively low dispersion of annualised returns, averaging 3.03%. However, a look at the figure above shows that both factors are rather uncorrelated over time (0.04). Moreover, neither factor has been able to generate positive returns in recent years.
Carry
As mentioned above, alternative carry risk premia are among the most profitable alternative factors, with an average annualised return of 8.42%. Within this group, annualised returns range from 12.7% (RC Commodities Carry) to 4.1% (RC Credit Carry). Most of the alternative carry factors are sensitive to market crises such as the CoVid 19 crisis in March 2020. For example, RC Equities Carry has the highest equity beta (0.29) in this group, while RC Commodities Carry (0.01) and RC Rates Carry (-0.10) have the lowest exposure to traditional equity market risk.
Event
The single event factor (RC Equity Event) seeks to capture exposure to potential merger arbitrage opportunities (currently mainly in the US). The factor has only moderate exposure to global equity markets (MSCI World) with an equity beta of 0.23.
Liquidity
The five liquidity factors have the second highest cross-sectional dispersion of annualised average returns. While the RC Commodities Liquidity factor (13.4%) and the RC Multi-Asset Liquidity factor (12.5%) are the most profitable of all alternative risk factors, the RC Equities Liquidity factor delivered an annualised return of only 0.5%. Apart from the RC Multi-Asset Liquidity factor (equities beta of 0.23), all other factors within the liquidity group are relatively uncorrelated with the MSCI World Index. As shown in the chart above, RC Commodities Liquidity and RC Equities Liquidity separated as hedges during the recent CoVid 19 crisis.
Low volatility
The six Low Volatility factors have the highest dispersion of annualised return. The group can be divided into factors with high annualised returns – commodities (11.8%), equities (7.6%) and credit (5.9%) – and factors with low average annualised returns – multi-asset (-5.3%), FX (-1.9%) and interest rates (1.0%). While the latter group with equity betas between -0.67 (multi-assets) and -0.12 (interest rates) has a hedging elements for equities, the first group with betas between -0.04 and 0.14 is more equity market neutral.
Mean Reversion
The two Mean Reversion factors have shown parallel movements most of the time, but have diverged, for example, during the recent CoVid 19 recovery. While the returns on the Mean Reversion factor for commodities are rather smoothly distributed, the Mean Reversion factor for equities is characterised by frequent large negative jumps, for example during the CoVid 19 outbreak. Therefore, the equity beta (0.35) is much higher than that of commodities (0.0).
Momentum
Apart from credit momentum, all other momentum factors are characterised by low equity beta (-0.16 to 0.2). Unlike Mean Reversion in equities, Equity Momentum has shown large positive swings during market crises such as the CoVid-19 breakout. However, in the recent CoVid 19 recovery, the factor gave back some of its gains.
Multi Premia
The four RC Multi Premia factors group together indices that combine several alternative risk premia. This has resulted in fairly stable returns in the past, as can be seen in the chart above. The group of factors itself has produced an average annual return of 8.2% with relatively little dispersion between the individual factors. Multi Asset has delivered the highest return (10.7%) in this group. The equity market beta tends to be moderate to negative, ranging from 0.13 to -0.12.
Size
The only factor, Size, has low equity market exposure (0.11 beta) but relatively high volatility and negative returns on average (-1.2%).
Seasonality
The two seasonality factors attempt to capture the dynamics of seasonal overvaluation in commodities and FX. The track record of the two factors shows similar patterns, as can be seen in the chart above. Both factors have an equity beta of close to zero.
Value
Since inception, all Value factors have had positive returns (5.7% to 3.8% annualised). However, since 2010, Equities Value has had weak negative performance. The other three factors performed better. The equity beta is close to zero for commodities and equities and negative for FX and interest rates (-0.08 and -0.15).
Volatility
Five of the six Volatility factors are characterised by relatively high equity betas (0.40 to 0.16) and thus represent short vol strategies. In contrast, the Multi-Asset Volatility factor has a strongly negative equity beta of -0.58 and thus functions as a long vol strategy and classic hedge in the event of sharp market declines.
Quality
The quality factors aim to capture the premium associated with high quality equity stocks. The alternative bank risk primaries typically use earnings variability, return on assets and accruals ratio to identify such stocks. The factor has historically delivered relatively consistent returns at a low equity market beta (0.06).
Beta
The chart below plots the cumulative returns of RC’s Beta factors:
(click on the chart below to increase the size)
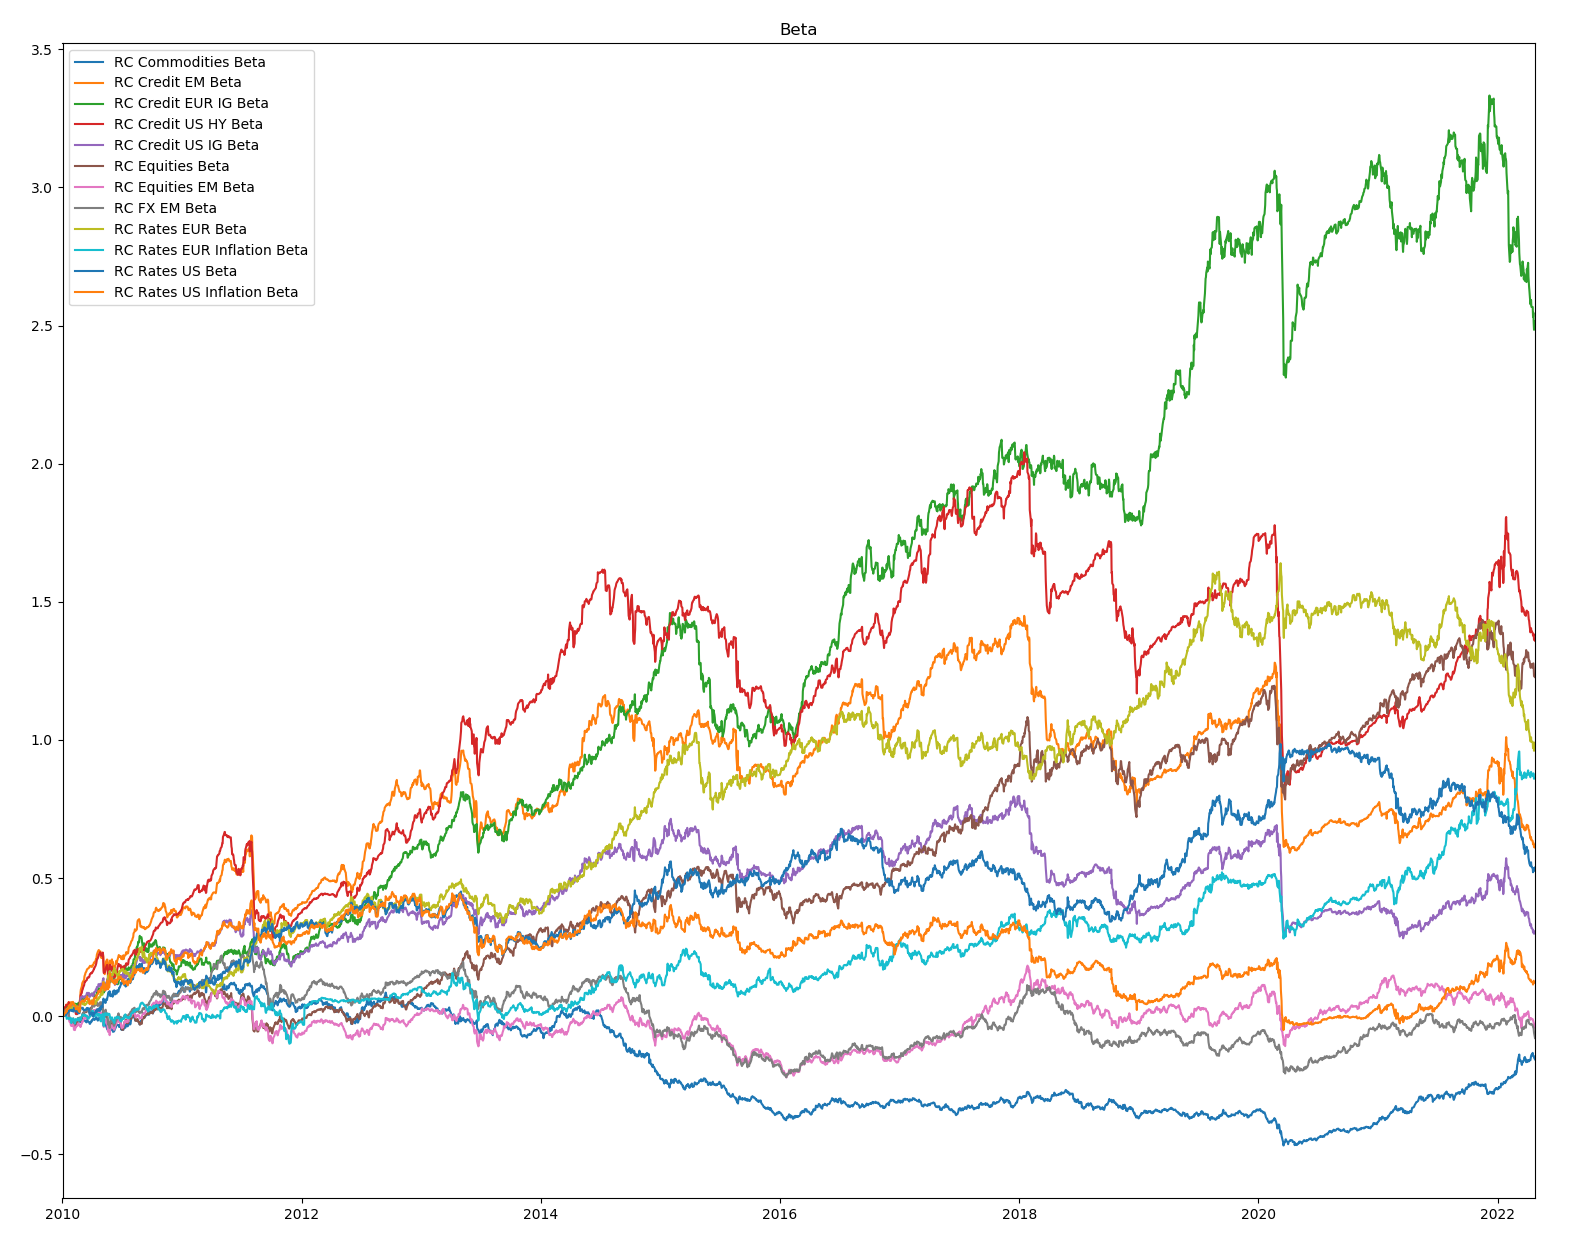
Figure 2: Cumulative Returns of Beta Factors
Resonanz insights in your inbox...
Get the research behind strategies most professional allocators trust, but almost no-one explains.