QIS Dashboard
Explore QIS performance.
A clear view of QIS performance — built from Resonanz Capital composites.
QIS Composite Performance
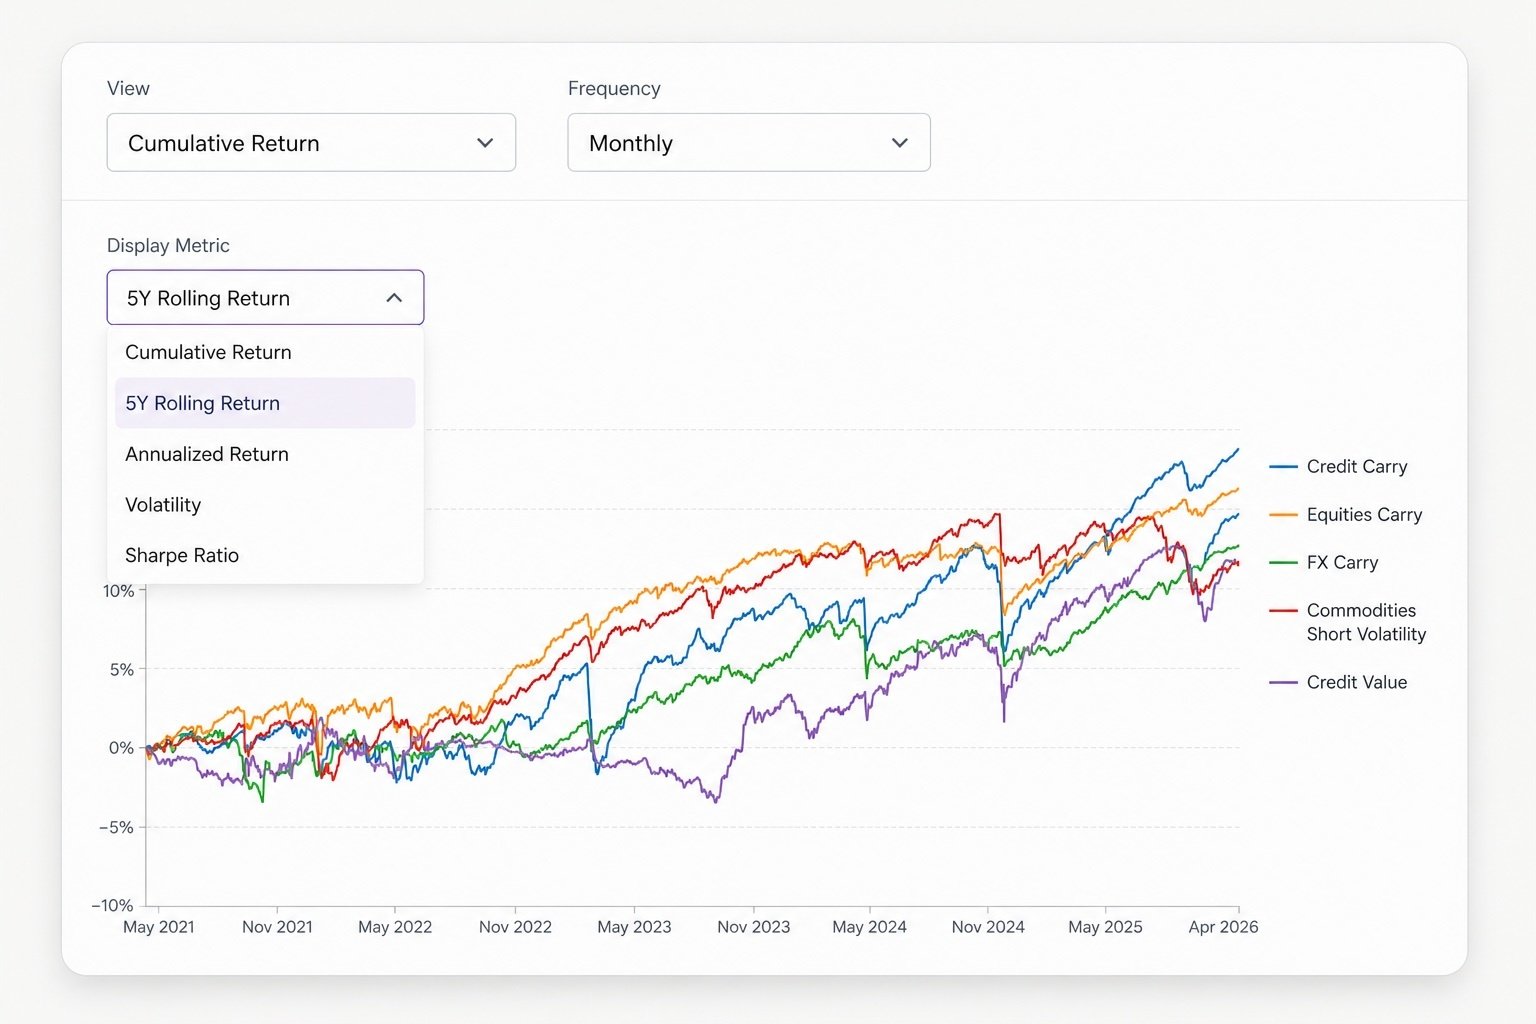
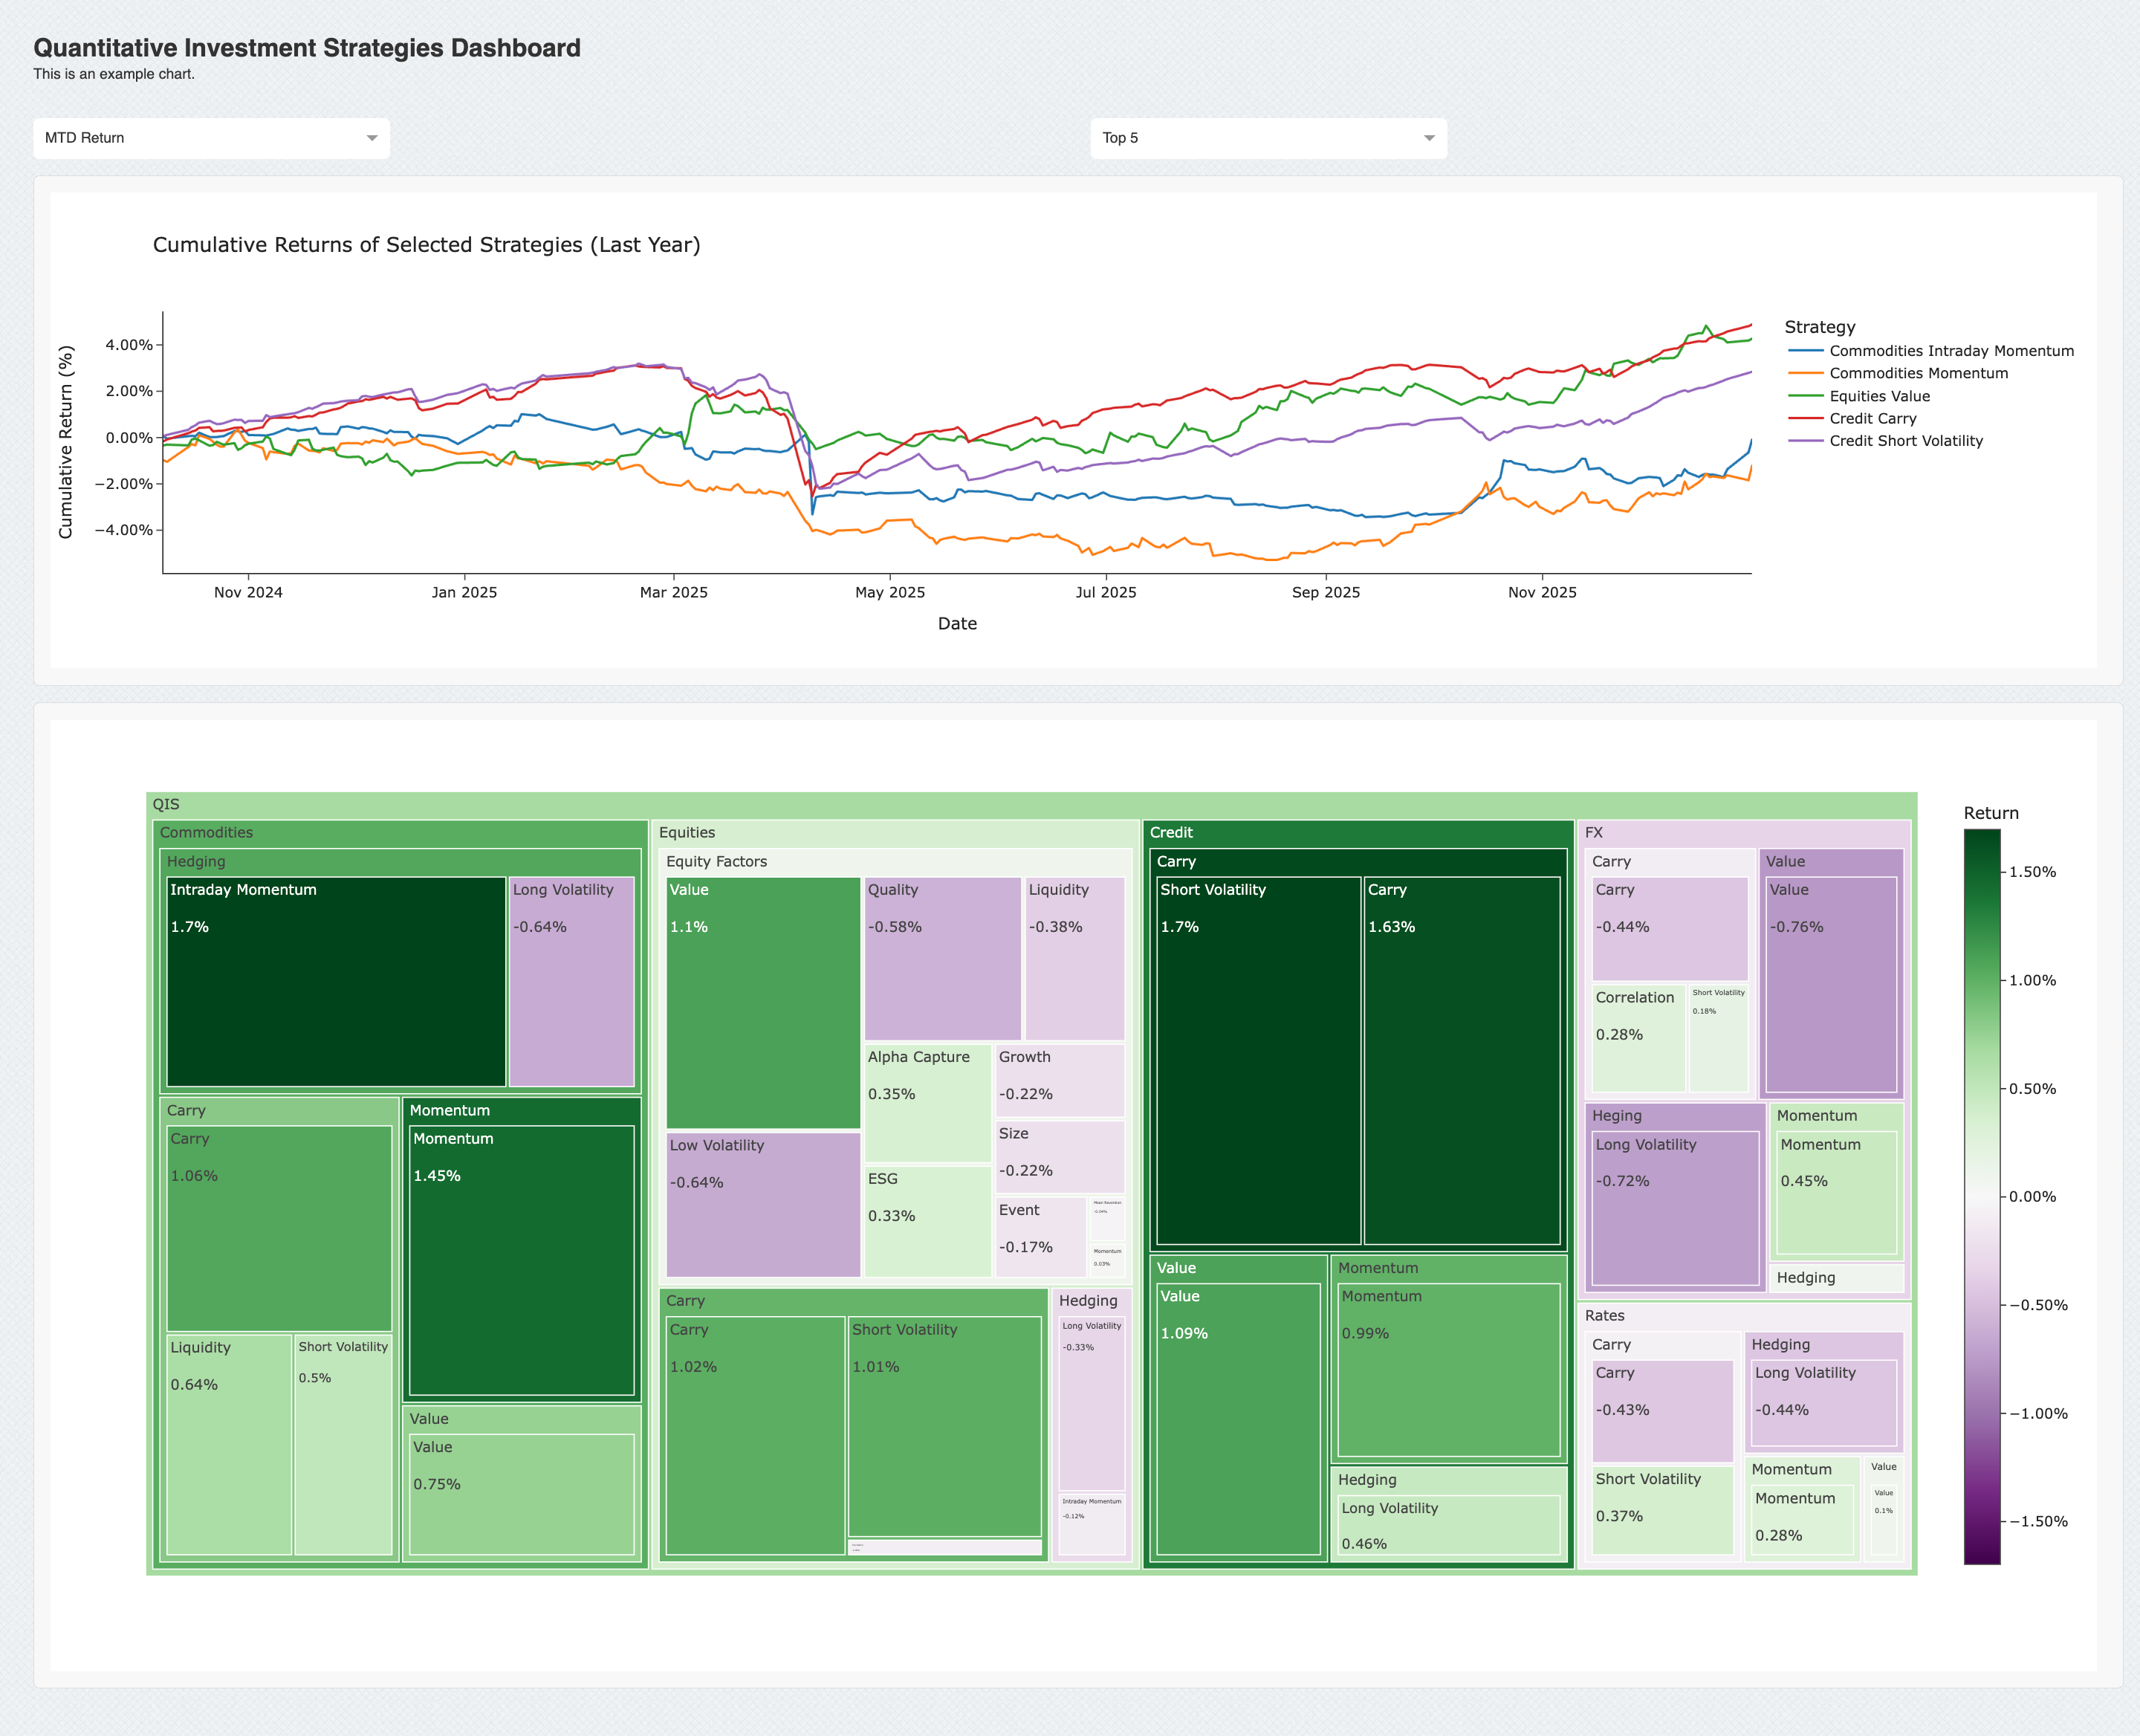
Explore live composite data across QIS strategies, including rolling returns, factor groups, and comparative performance views. The dashboard is designed to help professional investors identify patterns, compare strategies, and monitor performance dynamics.
Why this matters
QIS performance data is difficult to compare consistently. The dashboard gives professional investors a structured snapshot of what worked, what lagged, and where leadership shifted across strategy groups.
Compare strategies faster
Review rolling return patterns
Spot leadership shifts across composites